Showing posts with label Football Outsiders. Show all posts

Thursday, August 23, 2007

Accuracy of Vegas' Win Projections

In the post about the accuracy of PFP's 2006 win projections, I just got a comment linking to another interesting analysis of their accuracy as well as Vegas' win projections for 2005 and 2006. There's an Excel file with those numbers at the link.

The projections are within the 4.5-11.5 range, so they cover a pretty good range. It's about as wide as you'd want it. What surprised me is that in both years, exactly half the teams performed over and half the teams performed under their projection. Perhaps it is just a mathematical certainty that it will happen, but I would have expected random perturbations either way as in coin flips. But 2007 might buck that trend, so we'll see.


2005:
Mean abs. err.: 3.0469 games
Corr. coef. with actual wins: 0.22331
Largest error: 5.5 games (Jets, Texans, Eagles)
Smallest error: 0.5 games (Patriots, Chiefs, Vikings, 49ers)
No. of predictions within:
0-1 games: 5
1-2 games: 4
2-3 games: 5
3-4 games: 8
4-5 games: 7


2006:
Mean abs. err.: 2.3438 games
Corr. coef. with actual wins: 0.36088
Largest error: 5.5 games (Ravens)
Smallest error: 0.5 games (Bills, Texans, Colts, Chiefs)
No. of predictions within:
0-1 games: 8
1-2 games: 9
2-3 games: 6
3-4 games: 5
4-5 games: 3

In 2006, both PFP's projections and Vegas' projections were within 2 games of being exactly right for 17 out of 32 teams. But the one thing that strikes me about PFP's numbers is that the number of predictions curve is monotonically (i.e. always) decreasing as the error becomes larger (10,7,5,4,3). In the two years shown here, the curve for Vegas is more irregular, though 2006 is better than 2005. In 2005, more teams' win projection errors were within 3-4 games than any other margin (4-5 games followed closely). The PFP projections correctly predicted the Over 8 times and the Under 8 times, so using PFP to make all your over/under season win total bets, you would have been exactly 50% correct. Overall, I'd say that PFP's projections are better, and I'm really surprised to see that Vegas had a mean absolute error of 3 games in 2005. But the gap between the two is not that wide.

Since I was curious, here's how the Vegas regular season win total lines project the final standings by division:

AFC EAST
New England
New York Jets
Miami
Buffalo

AFC NORTH
Baltimore/Cincinnati (tie)
Pittsburgh
Cleveland

AFC SOUTH
Indianapolis
Jacksonville
Tennessee
Houston

AFC WEST
San Diego
Denver
Kansas City
Oakland

NFC EAST
Philidelphia
Dallas
New York Giants
Washington

NFC NORTH
Chicago
Green Bay
Minnesota
Detroit

NFC SOUTH
Carolina/New Orleans (tie)
Atlanta
Tampa Bay

NFC WEST
Seattle
Arizona/St. Louis/San Francisco (tie)

Read More......

Monday, August 6, 2007

How Often Does the Better Team Win?

In the National Football Leagues, no win can be guaranteed. One play can have a large impact on any game. It's part luck, but it's part happenstance too. It takes skill to get an interception, but it's the happenstance of what play is being run, and thus where the players are, that largely dictate if the interception is returned for a touchdown or not. If the interception occurred in the red zone and was returned for a touchdown, that's at least a 10 point swing. So a play with a 2.96% probability of occurring (league average interception rate) has an inordinately large impact on the game. Brian Burke's blog had a very good piece on how much luck is involved with winning and concluded that half of winning games is luck (52.5% to be exact) so the better team is going to win around 74% of the time. I was curious to see how it worked out in reality and further validate my assertion that interconference games have more inherent variance and less predictability than intraconference games. To decide the better team, I simply used total DVOA from Football Outsiders (1996-2006). Please note that the DVOA stats are over the entire regular season and postseason, so they are retrodictive, not predictive. The predictive ability of total DVOA is not as good. If DVOA had a predictive accuracy of 70%, I wouldn't be working as hard on a prediction system.


Average result means how many more points the better team scores on average. Average margin of victory means how many more points the winning team scores on average. The averages are by year, so the total proportion of games won by the better team, etc. will vary slightly from the numbers listed here. Part of the original study on interconference study was to see how much year-to-year variance there was in the outcomes of those games.


InterconferenceInterdivision
Better Team Win %Avg. ResultAvg. Margin of VictoryBetter Team Win %Avg. ResultAvg. Margin of Victory
Mean, 1996-20010.680566.922212.2280.664465.69411.042
Std. Dev, 1996-20010.0798732.50310.997760.0477331.5790.75167
Mean, 2002-60.656.931312.2130.689586.539611.169
Std. Dev, 2002-60.0450151.15370.899530.0485241.49970.92161


IntradivisionAll Games
Better Team Win %Avg. ResultAvg. Margin of VictoryBetter Team Win %Avg. ResultAvg. Margin of Victory
Mean, 1996-20010.69066.444911.2320.680966.356911.42
Std. Dev, 1996-20010.0475671.11090.705740.026391.03430.24626
Mean, 2002-60.733337.072911.3560.696096.837511.5
Std. Dev, 2002-60.0502811.0890.530040.0275380.648520.31041


So with the 20/20 hindsight of each entire season, the better team has wins about 69% of games, close to the 74% reported in Brian's blog, which was based on 2002-6. When looking at 2002-6 intradivision games, he was pretty much dead on. 73.333% vs. 74%. Most of the discrepancy can be traced back to interconference games. The divisional realignment in 2002 reduced year-to-year variance in the percentage of games won by the better team, but it's also reduced the average percentage from 68% to 65%. It's interesting that the average margin of victory is larger in interconference games than in the other types, but I'm not sure what that means.

I have two ideas on possible reasons why fewer interconference games are won by the better team. First, maybe coaches have more problems adapting strategy to opponents they don't see as often. An interconference matchup occurs only once every four years now (before, some matchups were much more common than others). Coaches have only a week to prepare for games, so they can only learn so much about a team's strengths and weaknesses. Obviously, the more time they have to study opponents, the more they will learn about them. So every time the interconference matchup comes up, the coach probably has to throw out a good deal of what he learned the last time. With intradivision matchups, you see the opponent twice a year and can re-use knowledge gained from previous matchups. Second, maybe stats should be adjusted for conference quality in addition to specific opponent quality like in baseball. I'm not sure this would work, given that the rules in both conferences are the same, unlike in baseball. Given that 75% of the season is intraconference, though, perhaps it's slightly inaccurate to judge a team based on the whole league, rather than their specific conference, when trying to predict an intraconference game. I've toyed with implementing this idea and might pursue it sometime in the near future.

Read More......

Sunday, August 5, 2007

Another Look at the Importance of Offense and Defense in the Playoffs

In this post, I examined why defensive performance has a higher correlation with playoff success and determined that the root was the greater abundance of very good offenses among playoff teams. Thus, teams needed better defenses to make it through the playoffs. It's not a matter of one unit being more important than the other. It's a matter of balance. In this article, I redid the previous experiment using Football Outsiders' DVOA stats instead of my own VOLA stats. DVOA covers the same time period as the original experiment: 1996-2006. It's very important to point out that my VOLA statistics covered only the regular season, but the DVOA stats used here are based on regular season and postseason (where applicable) performance. This probably biases certain stats used here, such as the average DVOAs of Super Bowl winners, simply because the DVOAs used take into account that the teams performed well against good teams in the postseason, which isn't necessarily indicative of their regular season performance (see the 2006 Colts). The results, however, support what I said the last time.


For the following tables, O=Offense, D=Defense, R=Run, P=Pass, ST=Special Teams.

The correlation coefficients with the seeds are actually the correlation coefficients with 7-(Seed #), where the seed # is 7 for non-playoff teams. So the second column includes all teams (where the seed input is between 0 and 7), but the third column includes only playoff teams (where the seed input is between 1 and 7).


Corr To WinsCorr to Seed (all teams)Corr to Seed (playoff teams only)
O0.64780.495780.19407
RO0.46970.357970.23226
PO0.62410.479160.11531
D-0.5252-0.3899-0.27018
RD-0.3517-0.25361-0.202
PD-0.5066-0.37634-0.25634
ST0.26030.237870.18571


For this table, defensive DVOAs less than or equal to -X% are tallied in the ≥X% columns.


ALL TEAMS≥10 (Teams)≥10 (%)% Made Playoffs≥20 (Teams)≥20 (%)% Made Playoffs
O6819.82579.412216.122490.476
RO4513.1266.667113.20763.636
PO10129.44673.2674914.28685.714
D7722.44968.831174.956382.353
RD9728.2853.608216.122447.619
PD9527.69761.053349.912570.588
ST10.291550000


PLAYOFF TEAMSMedianMean
O6.657.475
RO1.551.1735
PO11.8513.123
D-7.15-6.903
RD-7.9-7.0205
PD-8.55-6.8765
ST0.950.97121


SB WINNERSMedianMean
O11.512.582
RO63.9273
PO17.820.936
D-15.1-14.155
RD-12-10.955
PD-14.9-17.373
ST2.22.3455


Teams with very good offenses are more common than teams with very good defenses, and teams with very good offenses are more likely to reach the postseason than teams with very good defenses. Having either still gives you a pretty good chance of making the playoffs. Having both makes it nearly certain. 28 out of 30 teams (93.33%) that had at least a 6% Off. DVOA and at least a -6% Def. DVOA made the playoffs. The only 2 teams not to were the 2002 Miami Dolphins, who blew a big lead late in the final game of the season against the Pats, and the 1999 Oakland Raiders, who were #3 in total DVOA but posted an 8-8 record.

Defense, however, has the higher correlation with playoff seeding. When nearly 70% of playoff games are won by the home team, seeding becomes very important. Then again, a higher seeding usually indicates a better team. Looking at the DVOAs, the home team is the better team in about 67% of postseason games, and the home team wins 69% of postseason games. The home teams win 70% of games in which they are better and 60.6% of games in which they are worse (though this number has dropped to 40% since the realignment in 2002).

On average, the Super Bowl winner is a balanced team. The offense DVOA is above 10%, and the defense DVOA is below -10%. And actually, the average defense DVOA comes out slightly higher. Special teams DVOA is positive as well. The worst offensive DVOA of a Super Bowl winner belongs to the 2000 Ravens (-7%), and the worse defensive DVOA belongs to the 2006 Colts (11%). The Ravens, however, at least had a good running game (8.3%). In 11 Super Bowls, the team with the better total DVOA won 9 times. The two exceptions were the 2001 Patriots and the 2006 Colts. The 2006 Colts, however, had the better weighted DVOA, in which the latest games are weighted more strongly. Seven champions had better offensive DVOA, and seven champions had better defensive DVOA. Six champions had better special teams DVOA. Four had better offensive and defensive DVOA. Only 2 champions were better in all three categories. All of the champions were better in at least one category (2001 Patriots had better ST DVOA than the Rams).

People often point out the Ravens and the Bucs to say that defense wins championships. While Baltimore won in 2000 with a -7% offensive DVOA, they had a better total DVOA than the Giants, who had a good defense (-8.2%) but a weak offense (4.4%) compared to the Ravens' monstrous -30% defensive DVOA. The Ravens also had better special teams (7.2% vs -4.4%). Similarly, the Bucs had better special teams and defense, which was historically good. The Raiders' offense, which was damned good (24.4%) couldn't hold up, but it's hard to quantify the impact of Barrett Robbins and Jon Gruden's vast insider knowledge. The first paragraph of the game summary section of Super Bowl XXXVII's Wikipedia entry indicates that the Raiders' offense was at a huge disadvantage because of Gruden's knowledge. So you can win with a mediocre offense (4 out of 11 had <1% DVOA), but it's reliant on the matchup (the Raiders, the 2003 Patriots' 0.4% Off. DVOA and the Panthers' -7.2% Off. DVOA) and you probably need a ridiculously good defense. Only two teams, however, have won with a mediocre defense (>0% DVOA). The 1998 Broncos had a really good offense led by John Elway and Terrell Davis (28% DVOA), and the 2006 Colts had a really good offense. The Broncos played a well-balanced Falcons unit (10.1% Off, -13.4% Def, 2.8% ST), too.

Teams like the '00 Ravens and '02 Bucs have struggled since their Super Bowl wins because defensive performance is less consistent on a yearly basis, and they did not have the capability on offense to make up for the performance loss. The Colts will struggle to duplicate their success in '06 as well without at least an average defense.

Read More......

Thursday, August 2, 2007

Accuracy of Pro Football Prospectus' 2006 Win Projections

I've been curious about exactly how accurate the mean win projections in Pro Football Prospectus are, so I threw together some stats.

PFP's 2006 Mean Win Projections


  • The mean absolute error was 2.2563 games.
  • 10 projections had an error of 1 game or less.
  • 7 projections had an error of more than 1 game and at most 2 games.
  • 5 projections had an error of more than 2 games and at most 3 games.
  • 4 projections had an error of more than 3 games and at most 4 games.
  • 3 projections had an error of more than 4 games and at most 5 games.
  • The biggest errors were for New Orleans (4.1 vs. 10) and Oakland (8.0 vs. 2).
  • The smallest errors were for Houston (6.1 vs. 6), Minnesota (5.9 vs. 6), Philidelphia (9.8 vs. 10) the Giants (7.8 vs. 8).
  • The correlation coefficient of the mean win projections with actual win totals was 0.3653.

Read More......

Tuesday, July 31, 2007

Does Defense Matter More in the Postseason?

In Pro Football Prospectus 2006 and 2007, it is shown that defensive performance (as measured by DVOA) correlates more with playoff success than offensive performance. Similar findings have been made in baseball. As correlation is not causation, the question is why offensive performance is seemingly less important. Originally, I hypothesized that defensive performance was less consistent and needed to be better overall so that the worst performances were still good enough to win. That didn't pan out particularly well, so it was back to the drawing board. Today's hypothesis is a little more straightforward.

If offensive efficiency has a higher correlation with regular season wins than defensive efficiency, it means that the offenses in the playoffs are already very good. When everybody is good, then everyone is average. If the quality of defenses isn't as good, however, then teams with good defenses will be more successful in the playoffs.


(The test data is on the 1996-2006 seasons.)

The average efficiencies (yards per play) for playoff teams are as follows:


  • Run Off 4.1126 yards, 1.5356% VOLA (Value over League Average)
  • Run Def 4.0076 yards, 1.0906% VOLA
  • Pass Off 6.379 yards, 8.4316% VOLA
  • Pass Def 5.6086 yards, 4.6672% VOLA


So by VOLA standards, defenses of playoff teams aren't as good as the offenses. The one caveat is that there are 20+ more instances of Pass Off. VOLA above 10% and 20% than for Pass Def. VOLA. Take that as you will. It might just mean that there are a lot of crappy quarterbacks in the league weighing down the league averages and the very good QBs are also very consistent (Brady, Manning, Culpepper, Warner of the Rams, Green, Elway, Favre).

Let's take a look at the correlation coeffiecients with playoff seedings, specifically 7-seed # for playoff teams only. By the hypothesis, we'd expect the defensive eff. correlations to be higher because the offenses are all very good across the seeds.

The correlation coefficients with 7-(Seed #) listed as Offense, Defense are as follows:

  • Run VOLA .10812, .096591
  • Pass VOLA .11949, .3477
  • Sack Rate VOLA .1075, .23407
  • Third Down Conversion Rate VOLA .11549, .24107
  • Interception Rate VOLA .16219, .2013
  • Fumble Rate VOLA .0189, .16761


In every category except run efficiency, defensive performance has the higher correlation with playoff seeding. So defense is what sets apart the contenders from the one-and-dones. Creating turnovers is important, but a quarterback who is poor at decision-making plays an important part as well. Stopping drives on 3rd downs and forcing punts is also important. Interestingly, punt return averages have next to nothing correlation with the seeding, but kick return averages have a .18278 correlation. And although generally, none of these correlations are particularly strong, they seem to be strong relative to what you'd see in working with football data. I suspect ranking divisional winners 1, 2, 3 and now 4 cuts down on these coefficients, however.

Of course, seedings do not equal success, but seedings equal home field advantage, which does seem to play a significant part in playoff success. The following table shows the value of home field advantage for the intraconference playoff games (i.e. all games except the neutral-site Super Bowl). I've split it time-wise by the realignment of divisions, which cuts down on the sample size considerably, but there does seem to be an impact.


Avg. Result/Home Win %1996-20012002-2006
WC9.667/79.167%5.0/60%
DIV11.917/79.167%6.25/70%
CF3.0833/50%3.4/60%
OVERALL8.0303/71.212%5.1818/63.636%


Despite the seemingly larger home field advantage, it's important to note that higher seeding likely means better team. It is the defenses, however, that are making the teams "better," according to my interpretation of the data.


Avg. VOLA for Playoff Teams, 1996-2006
StatSuper Bowl WinnersSuper Bowl LosersNon-Super Bowl Winners
RO0.0225760.0285550.014699
RD0.0487160.0483320.007469
PO0.108370.112390.081933
PD0.0975420.0453390.042048
SRM0.0436730.0286130.066265
SRA0.084110.116890.12584
PR0.16781-0.00787710.020933
PC0.0408760.0100330.030548
KR0.046957-0.00242190.0095025
KC-0.02826-0.0204310.0022995
3CM0.124620.0675470.068969
3CA0.0341590.0447920.03235
PFD0.0064548-0.0537550.023301
PY0.02089-0.0216060.018493
IRG0.16230.114820.087693
IRT0.279410.0957940.053809
FRG0.0919160.0715520.11377
FRT0.190850.0956110.054136


The stats where the Super Bowl winners had a noticably higher average than the rest of the playoff teams were: Run Defense, Pass Defense, Punt Return, Third Down Conversion Rate Made, Interception Rate Given, Interception Rate Taken, and Fumble Rate Taken. Tangential but interesting: 1996 Green Bay, 1997 Denver, 2000 Baltimore, 2001 New England, and 2005 Pittsburgh had 25%+ VOLA on punt returns, while besides 2004 New England (-32.4%) and 1998 Denver (-2.16%), no Super Bowl winner had negative VOLA on punt returns. Back on point: the defensive efficiency on run and pass plays are much higher for Super Bowl teams than other playoff teams (4.87% vs. 0.007% run, 9.75% vs. 4.20% pass), but the gap in offensive pass efficiency isn't as large (10.837% vs. 8.193%). The pass offenses of playoff teams are good to begin with. Defenses of playoff teams aren't necessarily better.

Another way to look at it is who won with high VOLA and who won with low VOLA. Of the 11 Super Bowls looked at, only the 2000-2 winnners (BAL, NE, and TB) won with below average pass offense efficiency. Only the Patriots in 2001 won with below average pass defense efficiency. Of the 22 Super Bowl teams, 12 had 10%+ VOLA in pass offense (6 winners and 6 losers). In the same time frame, 73 teams had 10%+ VOLA, 59 of which made the playoffs. Eight teams had 10%+ VOLA in pass defense (4 winners and 4 losers), but only 47 teams had 10%+ VOLA in the same time frame, 34 of which made the playoffs. So 80.822% of teams with 10%+ VOLA in pass offense make the playoffs, and 16.438% of which make the Super Bowl. On the other hand, 72.34% of teams with 10%+ VOLA in pass defense make the playoffs, while 17.021% of those teams make the Super Bowl. The percentages show that a good offense will get you to the playoffs, but it needs to be balanced with a good defense in order to reach the Super Bowl.

That very good pass offenses are much more common than very good pass defenses is surprising and disconcerting. As a sanity check, I took a quick look at FO's 2006 DVOA standings. Eleven teams had 10%+ DVOA for pass offense, while only six teams had 10%+ DVOA for pass defense. The same is not true for rush efficiency. The surprising conclusion is that very good offenses are more common than very good defenses. The million dollar question is why they are more common. Perhaps offenses are easier to build because one man can make such a large difference in offenses (QB or RB), and one man cannot make such a difference in defenses. Brady never had great receivers (nor a great running back), but his skills led them to 3 Super Bowl wins. Though you might argue that Bob Sanders had a large impact last postseason as well.

Actually, the Colts also faced imbalanced teams in the 2006 playoffs. The Chiefs had an above average offense but below average defense and a worn out running back. The Ravens had a great defense but a so-so offense (6.26% Pass Off. VOLA, -17.275% Rush Off. VOLA). The Bears had a great defense but a below average offense. The only team the Colts faced in the 2006 playoffs with some amount of balance was the New England Patriots (#7 Off DVOA, #8 Def DVOA).

In conclusion, very good offenses are more common and more important to regular season wins, so playoff teams have good offenses on average to begin with. Consequently, teams with balance on both sides of the field are more likely to win.

Mind you, 11 seasons is a small sample size, but the initial results merit more research. In the future, I hope to expand on the sample size back a couple decades at the expense of dimensionality (restricted to simple rush/pass yards per play measurements) and revisit the last decade using DVOA.

Read More......

Thursday, July 12, 2007

Consistency of Offensive and Defensive Efficiency Part I - Regular Season

Looking at the correlations of the stats to regular season win totals, offense seems to be more important than defense to winning. For example,


  • Rush offense efficiency: 0.2052
  • Rush defense efficiency: -0.13296


However, Football Outsiders did a study that showed that defense was more important to postseason success. This seems to fall in line with the 2002-6 Colts. And the same pattern can be found in baseball, where pitching metrics (especially for relievers) become the most highly correlated to playoff success (Baseball between the Numbers). But correlation does not equal causation. Why does offense suddenly drop in importance?

With the the single elimination playoffs, the better team does not always necessarily win. Teams never perform at their absolute average, which makes predicting wins through teams' average performance fairly difficult. The Jaguars by a fair share of metrics perform really well on average, but it hasn't translated to a great record because of their inconsistency. Over one game, anything can happen. So the team that gets deeper into the playoffs should be reliable and consistent.

If defense is the better predictor of postseason success, then is defense more consistent from game to game? Over a 16 game sample, if it is more consistent, then because the outcomes of games are so varied, the more consistent defensive metrics are more lowly correlated with win totals. Or an alternative hypothesis might be that because defensive performance is less consistent, that you need a very good defense, for whom rock bottom isn't that bad, to overcome the consistently excellent offenses in the playoffs. From year to year, defensive efficiency changes more than offensive efficiency (according to FO), so more week-to-week inconsistency would be reasonable to expect. Let's take a look at what the numbers have to say.


Correlation of week's performance with next week's performance, Unadjusted for opponent
StatCorr. Coef.
RunOff0.08295
RunDef0.039186
PassOff0.17349
PassDef0.010152
SackRateMade(Def)0.01733
SackRateAllow(Off)0.18595
3rdDownOff0.071573
3rdDownDef0.011514
IntRateGiven(Off)-0.012781
IntRateTaken(Def)0.01926
FumRateGiven(Off)0.025166
FumRateTaken(Def)0.025957


Average in-season standard deviation of metric, Unadjusted for opponent
StatAvg. Std. Dev.
RunOff1.1732yds
RunDef1.1885yds
PassOff1.8195yds
PassDef1.8962yds
SackRateMade(Def)4.919%
SackRateAllow(Off)4.6111%
3rdDownOff13.096%
3rdDownDef13.405%
IntRateGiven(Off)2.9114%
IntRateTaken(Def)2.8889%
FumRateGiven(Off)2.7177%
FumRateTaken(Def)2.7259%


According to these methods using the unadjusted-for-opponent stats, defensive performance is less consistent than offensive performance (except maybe with turnovers). The differences between the average std. deviations of the offensive and defensive metrics are small, but they are at least consistent in favor of offense. The differences in correlation coefficients are more significant. Surprisingly, the week-to-week correlation of defensive performance is near zero. The performance of defense one week seemingly has no bearing on performance the following week whatsoever. And momentum is, at best, a small factor on offensive performance, which apparently doesn't matter as much in the playoffs anyway. Much of this variance likely has to do with the opponents, so now is the time when we adjust for opponents.


Correlation of week's performance with next week's performance, Adjusted for opponent
StatCorr. Coef.
RunOff0.095318
RunDef 0.052455
PassOff0.13248
PassDef0.026777
SackRateMade(Def)0.022664
SackRateAllow(Off)0.17386
3rdDownOff0.071013
3rdDownDef0.017221
IntRateGiven(Off)-0.0048146
IntRateTaken(Def)0.010823
FumRateGiven(Off)0.018135
FumRateTaken(Def)0.024204


Average in-season standard deviation of metric, Adjusted for opponent
StatAvg. Std. Dev.
RunOff1.1083yds
RunDef1.1073yds
PassOff1.9546yds
PassDef1.7601yds
SackRateMade(Def)4.6508%
SackRateAllow(Off)4.5034%
3rdDownOff12.682%
3rdDownDef12.788%
IntRateGiven(Off)2.9403%
IntRateTaken(Def)2.9135%
FumRateGiven(Off)2.6759%
FumRateTaken(Def)2.6853%


As it turns out, adjusting for opponents closes the gap a little, but offense is still more consistent overall. Adjusted for opponent, rush pass off. eff. have more variance than their defensive counterparts, but the week-to-week correlation is still well in favor of the offense.

Three out of the four tests I ran say that offensive performance is actually more consistent than defensive performance. So the conclusion seems to be that the defense needs to be very good so it can matchup okay with the consistently good offenses of playoff teams, even when they're not performing at their optimum. Does this reasoning make sense to anyone else? Definitely a topic for further exploration/discussion.


Addendum: Reply to bettingman's post
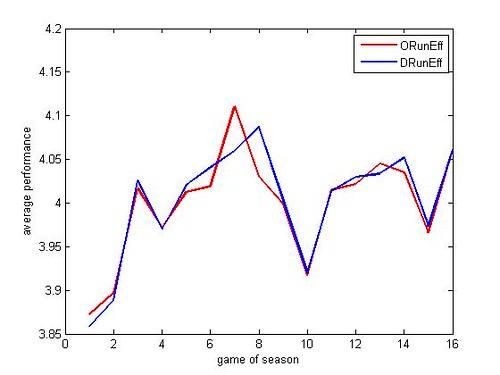
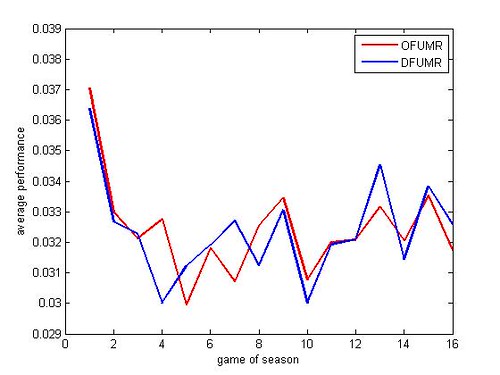
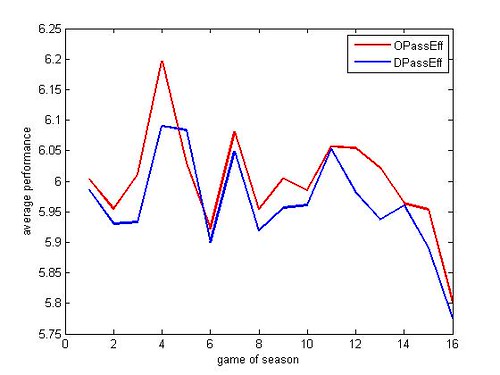
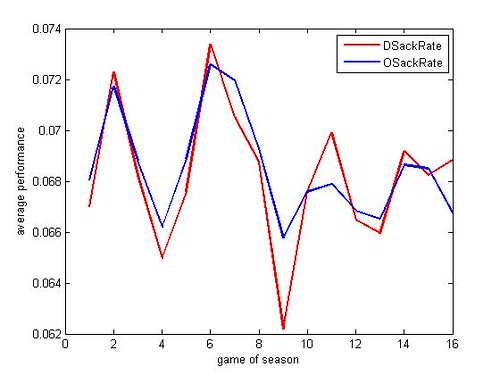
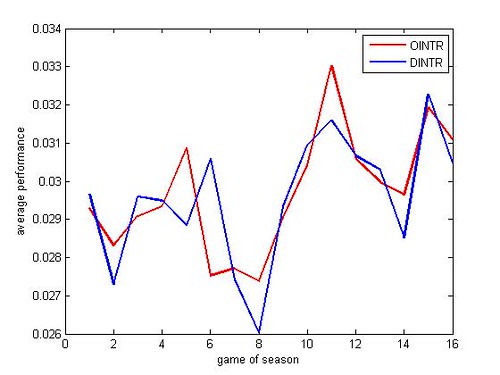
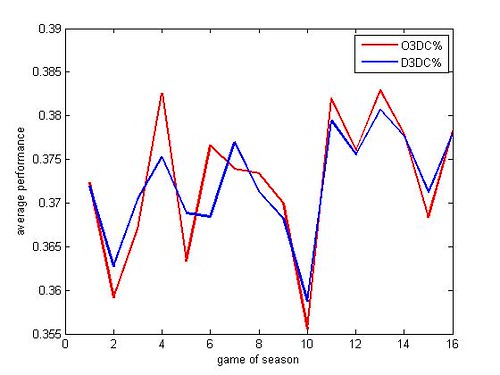
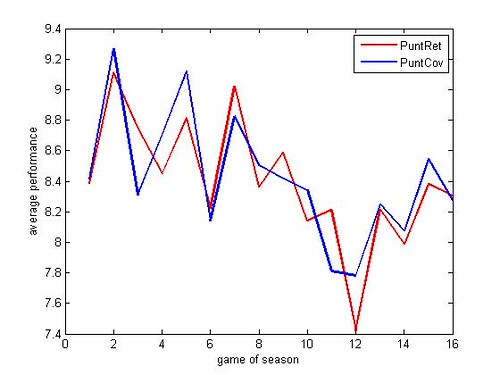
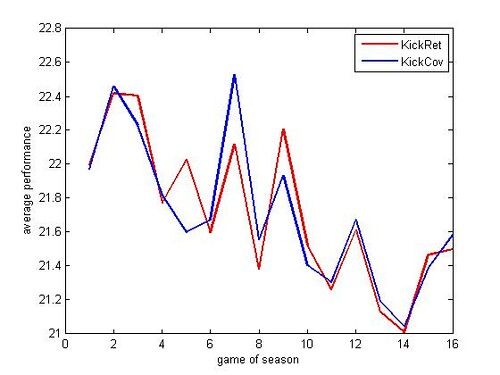
Do defenses adapt over the season and improve? Makes sense as they have to react to the offense. I just threw together these graphs. It's by game rather than week, so the two rates won't exactly sync up.


Rushing offense improves over the year by about .2 yards/attempt, but passing offense worsens over the year by about .2 yards/attempt. Sack rates don't trend either way, but interception rates increase by about .3%. So the passing game does indeed become less effective as the year progresses. The improvement in the rushing game might stem from defenses focusing more on the passing game. Also of note, kick and punt return averages decrease over the season but start to pick up again towards the end of the season. Clearly, special teams do a good job of adapating their return coverages. Do the return units start to adapt to the coverages as well?


Read More......

Tuesday, July 10, 2007

Creating Power Rankings

Just as a lark, I figured I'd try devising some power rankings using my model. The basic idea behind them is this: If every team played each other once at home, once at away, who would win the most?

I tested this idea on the 2006 teams after the end of the regular season. Using my adj. rush, adj. pass, sack, adj. 3rd down conv., and turnover data, I trained a linear regression predictor on all games before 2006. Then I used the model to predict the outcomes of all 992 possible games. I created 2 separate rankings: one based on the sum of margins of victory/defeat, one based on the expected winning percentage.


RankTeamSum of Exp. Margins
1PHI4.2027
2SD4.1368
3BAL3.8437
4JAX3.2917
5DAL2.1643
6CHI2.1514
7PIT1.9942
8NO1.8954
9IND1.7482
10NE1.5237
11MIN1.1935
12CAR1.1847
13ATL0.94039
14NYG0.84285
15MIA0.82191
16GB0.71736
17CIN0.52797
18DEN0.33802
19KC0.29031
20SF-0.685
21WAS-1.0359
22STL-1.4769
23NYJ-1.5889
24SEA-2.0378
25BUF-2.3402
26TEN-2.4492
27TB-2.8237
28ARI-3.2092
29DET-3.6094
30OAK-3.7756
31HOU-3.8764
32CLE-4.9007


RankExp. Win %Team
1tBAL0.83871
1tPHI0.83871
3SD0.80645
4JAX0.72581
5tCHI0.66129
5tNO0.66129
7NE0.64516
8tDAL0.62903
8tCAR0.62903
10tPIT0.6129
10tIND0.6129
10tMIN0.6129
13tMIA0.59677
13tATL0.59677
15NYG0.58065
16GB0.56452
17tCIN0.54839
17tDEN0.54839
17tKC0.54839
20tSTL0.43548
20tSF0.43548
22tNYJ0.41935
22tWAS0.41935
24SEA0.33871
25TEN0.32258
26BUF0.27419
27tOAK0.19355
27tARI0.19355
29tCLE0.17742
29tHOU0.17742
29tDET0.17742
29tTB0.17742


Looking at the bottom, it's about what you'd expect. Seattle, a playoff team, shows up at #24 in both rankings, but they were 8-8 in a weak division and suffered some losses due to injury and free agency. The Jets, another playoff team, show up at #23 and #22 respectively due to weak rushing offense and defense and average passing offense and defense. Seattle and the Jets were #25 and #19 respectively in Football Outsider's 2006 DVOA rankings. Philadelphia, despite a 10-6 record, shows up at #1 with a very strong offense (14.721% VOLA rushing, 20.58% passing unadj.). Jacksonville also obtains a very high ranking (#4) despite its record, a mediocre 8-8, thanks to well above average rush offense and defense. New England is a little low compared to DVOA (#10 and #7, #5) with average and below average YPA numbers but high sack and interception rates. The Super Bowl champion Colts are at #9 and #10 (DVOA #7) with 20.142% VOLA in pass offense and 26.09% VOLA in pass defense(!too high!) but -28.29% VOLA rush defense.

So overall, the rankings turn out very similar to the DVOA rankings with individual teams gaining or losing a couple spots. There are no major disparities, however, that I can see, except maybe Dallas showing up too high in the ranking by points. It would be interesting to calculate these rankings over the season and compare these with other rankings.

Figures and article corrected on 7/12/2007 after finding errors in some box scores.

Read More......

Saturday, June 16, 2007

The Value of Homefield Advantage Part II - Weather

Editor's Note: 2005 Saints games and the ARI/SF Mexico City game are thrown out because of neutral site issues. The Saints played "home" games in a warm weather environment and a dome. They also had a faux home game in cold, grim New Jersey. The numbers have been subsequently corrected. 7/11/07

During the NFC Championship this year, they threw out some stat about dome teams being winless in road NFC championship games or something along those lines. And the Saints followed that trend by falling to the Bears 39-14. In the summer, players from cold-weather cities aren't used to the intense heat and humidity of places like Miami. In the winter, players from warm-weather cities aren't used to the icy winds, sleet, and snow of places like Green Bay and Cincinnati. Dome teams always seem to be at a disadvantage on the road when they don't have the luxury of A/C during games. Well, teams like the 1999 Rams were also built for the speed they could achieve on Astroturf. Anyway, the numbers bear out weather playing a factor in home field advantage. See how the spread accounts for different weather situations.


Average Result/Average Spread
Cold @Warm @Dome @
@ Cold2.2983/-2.43983.9104/-2.74123.4324/-2.4611
@ Warm2.0283/-1.93792.4495/-2.49794.25/-2.7147
@ Dome0.3688/-2.70792.2527/-3.01572.7407/-2.4198
% of games won by home team/% of games home team was favorite
Cold @Warm @Dome @
@ Cold56.358%/66.302%64.792%/71.637%60.81%/66.32%
@ Warm59.109%/64.689%55.37%/65.25%61.92%/68.36%
@ Dome52.13%/67.42%56.41%/69.11%58.64%/58.49%


Average Result/Average Spread, Weeks 1-8
Cold @Warm @Dome @
@ Cold2.1404/-2.40242.7937/-2.85482.6522/-1.9890
@ Warm2.7115/-2.20073.2378/-2.22974.6964/-3.1594
@ Dome-0.3846/-2.66252.5469/-2.81110.4091/-1.9222
% of games won by home team/% of games home team was favorite, Weeks 1-8
Cold @Warm @Dome @
@ Cold57.192%/67.619%63.677%/72.903%56.52%/65.93%
@ Warm62.019%/65.789%60.84%/64.86%58.04%/72.46%
@ Dome50.77%/63.75%58.59%/71.11%51.52%/55.56%


Average Result/Average Spread, Weeks 9-17
Cold @Warm @Dome @
@ Cold2.4319/-2.47174.8794/-2.64714.1139/-2.8824
@ Warm1.5315/-1.74011.7622/-2.7363.9122/-2.4306
@ Dome1.0132/-2.74491.9931/-3.1984.3438/-2.7896
% of games won by home team/% of games home team was favorite, Weeks 9-17
Cold @Warm @Dome @
@ Cold55.652%/65.182%65.759%/70.588%64.56%/66.67%
@ Warm56.993%/63.861%50.61%/65.60%64.86%/65.74%
@ Dome53.29%/70.41%54.48%/67.33%63.54%/60.66%


Note: The Houston Texans normally play with the roof closed, so they are considered a dome team. Idea from Football Outsiders. Arizona is still a warm weather team, though.

Weeks 1-8 cover roughly September and October, while Weeks 9-17 cover November-January. Warm-weather teams lose some home field advantage in the winter, and cold-weather teams gain some. Dome teams just get screwed against cold weather teams. Home field advantage is surprisingly worth next to nothing. The spread is mostly insensitive to home field climate matchups, leaving it particularly inefficient in dealing with dome teams. But can this be corrected for? Let's assume that the same inefficiencies show up in my model.

Adding binary variables for the home field climate matchups to my model slightly increases its accuracy on 2001-6, from 61.213% to 61.916%. The correlation coefficients of these variables to the final score margin are all very weak, ranging from -0.02 to 0.055. All 3 of the dome team home variables have negative correlations. Perhaps dome teams are just less talented on average because of the Lions and the Texans.

I also took the average results for each climate matchup and created a schedule difficulty score based on that. The score had 0.09735 correlation with win totals, suggesting that weather has a small overall effect on games.

Perhaps the climate factor is categorized too broadly. Gametime temperature and weather (wind, rain, etc.) could be compared with monthly average temperatures for both team's home cities. NFL gamebooks dating back to 2002 are available on NFL.com that include that sort of data. One could even calculate wind chill and heat index to account for wind speed and humidity. It's a project for the future.

Read More......

Previous Works

This is an updated version of the "Previous Works" page from my research website:

Neural network quarterbacking: Michael Purucker

Michael Purucker began researching the use of neural networks for predicting NFL games in 1996. He used 5 basic statistics based on each team’s performance over the previous 3 weeks: Total yards gained – total yards allowed, Rush yards gained – rush yards allowed, turnover margin (takeaways – giveaways through fumbles and interceptions), time of possession, and victories. Out of all the networks used on the problem, a back propagation network performed the best, achieving a 70.83% accuracy rate over weeks 14 and 15 of the 1994 season. Using the Las Vegas spread, which predicts the winner and the margin of victory, the results improved to 75%. Two weeks, however, is a very small test set. In the 2 weeks, the BP network with the spread was 9 of 14 and 12 of 14 respectively. Three games is a very big variance, and there’s nothing to guarantee it won’t go 6 of 14 in some weeks. The rush yards statistic overlaps with the total yards statistic, and both of the statistics are comparing a team’s offense with its own defense by subtracting yards allowed from yards gained. This does not reflect the matchups that actually take place on the field. The victory input does not take into account the margin of victory, and close games can come down to random events that would have let either team win.


Neural Network Prediction of NFL Games

Joshua Kahn continued Purucker’s study, testing statistics from the entire season in addition to the previous 3 weeks and eliminating the victories input. Kahn cites Purucker’s system as being 60.7% accurate over time. Kahn’s 3 week averages were 37.5 and 62.5% accurate over weeks 14 and 15 of the 2003 season respectively. Using season-long averages, Kahn achieved 75% accuracy in each of those two weeks, while the ESPN experts achieved 57% and 87% accuracy on average (~72% 2-week average). The study has the same problem of an extremely limited test set, but the results demonstrate an interesting point. Using season-long averages rather than 3-week averages yields a better predictor. This makes sense given the larger sample sizes involved. Teams that start off the season 0-3 almost never make the playoffs, so a 3 game winning streak that leads to a 3-10 record does not reflect the team’s quality. That the ESPN experts experienced a 30% variance in the 2 weeks, like the predictor using 3-week averages, could reflect how recent performance can skew human perception.

NFL Point-Spread Ratings

Roger Johnson uses only the Las Vegas spreads to formulate rankings for each team in the league and based on those rankings, predicts the winner of each game for weeks 3-17. For 2003-2006, the system has averaged about 64% accuracy, making it slightly less efficient than the simple “Las Vegas favorite wins” predictor. About 65% of the teams favored by Las Vegas in weeks 3-17 of the 1999-2006 seasons won.

NFL Computer Handicapper Home Page

Daniel Imamura’s “Computer Handicapper” takes more advantage of the data found in the box scores to produce efficiency ratings for various aspects of each team. Rather than just yards per game, many of the ratings are based on yards per play but also factor in turnovers and touchdowns. Using these metrics along with the Las Vegas spread, the handicapper predicts the winner and the margin of victory. Though primarily intended for use on betting with or against the spread, the system has been 55-68% accurate over the 2001-2006 seasons in simply predicting winners.


Football Outsiers

FootballOutsiders.com has gone beyond box scores and into play-by-play data and their own game charting project to devise an array of new statistics, the centerpiece being Defense-adjusted Value over Average (DVOA). The idea behind DVOA is that yards per game statistics are lossy data because the amount of yards gained in an individual play varies in true value based on the context of the down, yardage to go, field position, time left in the game, and the current score margin. In DVOA, each play is categorized as a success or failure and assigned some value based on the context. Given the baseline rates of success and the success value for each play’s context, a team’s overall performance is assigned a value over average, which is then adjusted for the opponent’s average performance. DVOA can be broken down into performance in any situation and by a certain subset of players, allowing for a very fine-grained evaluation of why a team is likely to win. The coarse team total DVOA, however, has shown to be a good predictor as well. In weeks 3-16 of the 2004 season, the team with the higher total DVOA won 67.3% of games. After week 17, the accuracy fell down to 65.625%, having predicted 7 out of 16 correct games. In the last week of the season, many playoff positions have already been decided, so some teams will rest their starters, which could skew the results. In 2005, the team with the greater DVOA won 66.67% of games, but in 2006, accuracy plummeted to 55.80%.

Two Minute Warning: Using NFL injury reports to predict winners

Injury reports categorize players as probable (P(Playing)=75%), questionable (50%), doubtful (25%), or out (0%). Using 1-P(Playing), an injury score is assigned to each player, and the score for each team is the sum of injury scores for all of its players. The team with the lower injury score won 52% of games in 2001-4. Teams with injury scores of 3 fewer points than opponents won 55% of games in that same time frame. When looking at changes in injury score from week to week, the team with the lower injury score "delta" won 55% of games. My original research included injury score inputs. In 2001-6, the team with the lower injury score won 51.947% of games (week 3-17 only). In the same time frame, the team with the lower delta won 52.036% of games. The obvious problem with the injury score is that it's not weighted for player values, but it's not entirely clear how to best do that.

Read More......

Friday, June 8, 2007

The Initial Research

The website built for the original research. Contains graphs, tables, and more complete descriptions.

Rather than predict the exact final score of games, which is dependent on a good deal of random factors, I tried to create a system that could predict the margin of victory/defeat for the home team. The idea being that the better team will win and the better they are, the more points they'll win by. Again, random factors do play a part in the final score margin, but it at least reduces the number of possible outcomes to approximately 93. From 1994-2006, the maximum margin of victory was 49 points, and the maximum margin of defeat was 43 points. Essentially, given what we know about the two teams, I'm trying to see what the expected margin of victory/defeat, the average of the possible outcomes weighted by their probability, is.

Using box scores from this site, I gathered statistics I would use as inputs: rush offense vs. defense (yards per game), pass offense vs. defense (YPG), punt return vs. return coverage (yards per return), sack rate made vs. sack rates allowed (sacks per pass play), time of possession (season average), and turnover ratio (season cumulative). Rather than look at each metric individually, I wanted to compare a team's offense with its opponent's defense in an input to keep in line with the output of "how much better do I expect this team to be." Football Outsiders being a major inspiration for the research, I didn't want to use YPG statistics, but I was forced to. To capture some of what they did, I took the statistics (except TOP and turnovers) and turned them into values over league average.

Value over league average = (Team average - League average) / League average

For defensive measurements, where giving up fewer yards than league average is desirable, I simply multiplied VOLA by -1.

In a similar fashion, I tried adjusting for opponent quality, weighting a team's performance in each game by the opponent's performance over league average. If the opponents gain 150 yards per game rushing and the league average is 100 yards, holding them to 150 yards rushing is an average performance rather than below average. Each yard allowed is worth only 100/150 = 2/3 of a yard. Thus...

Adjusted VOLA = (Team's adjusted average - League average) / League average

If the equations are just stating the obvious, my apologies. To compare home team rush offense with away team rush defense, I merely subtracted the away team's rush defense AVOLA from the home team's rush offense VOLA. Same with the converse and for pass offense, pass protection, and punt returns.

In addition to the statistics, I also used home field climate as an input. Based on Football Outsiders' work, I divided home field climate into 4 types: warm, cold, dome, and Denver (high altitude). For each team, there are 4 binary (0 or 1/true or false) variables representing the 4 possible climate types.

So we have all of these statistics. What do we do with them? Well, as I was studying artificial intelligence when I did this, I went for methods such as artificial neural networks and support vector machines. The methods were tested on the years 2000-2006, one at a time, and training on all years previous to the test set year. I also tried comparing my results against the spread, which similarly represents the expected margin of victory/defeat.

All methods, including the spread, had the following weaknesses:


  1. 10 point barrier: Predictions were conistently off by at least 10 points on average from year to year. Only a couple methods on a couple years could get to a mean absolute error of 9.7-9.8 points. Interestingly, games in 1994-2006 were won by 11.329 points on average.
  2. Too many games classified as wins for home team: 58.51% of games were won by the home team from 1994-2006. Methods would regularly classify 65-80% of games as home team wins.
  3. Small range of predictions: The predictions usually ranged from about -10 to about 15. The actual range of outcomes is -43 to 49. 27.681% of games from 1994 to 2006 were won by more than 15 points. My guess is that this inflated the error, though I haven't checked this out for sure. As soon as I typed this, I put it on the to-do list, however. If you graph the actual outcomes vs. the predicted outcomes, it ends up looking like a parallelogram as seen below.
  4. Sensitive to yearly variations in home-field advantage: The average outcome of an NFL game from 1994 to 2006 was the home team winning by 2.63 points. 58.51% of those games were won by the home team. In 2006, however, only 53.125% of games were won by the home team, and the average result was the home team winning by 0.84 points. As a result, the performance of all methods, including the spread, was aberrantly poor. In 2005, the average result was the home team winning by 3.677 points, and the home team won 59.14% of games. As a result, the performance of all methods was aberrantly good.


The methods I used ran into the following problems:

  1. Some predictions close to zero: About 10-15% of the predictions were that the game would be won by less than one point. Furthermore, about half (5-8%) of those predictions were that the game would be won by less than half a point. As long as they're still not zero, they can still be used for win/loss prediction, but it just doesn't look good to say "Team A is predicted to win by 0.15 points." I'd be curious to see what the win/loss accuracy of these predictions is.
  2. Input stats have very low correlation to margin of victory/defeat: The problem with YPG stats is that they don't necessarily represent quality. Teams with comfortable leads run the ball more to eat up the clock, so the rushing metrics have the highest correlation to the margin. Correlation does not equal causation, however. It's possible the team used the passing game to rack up points quickly, and the defense took care of the rest. Conversely, teams that are behind will abandon the running game in favor of the passing game, which covers more ground in less time. Thus, the passing metrics have a low correlation to the margin.

    Other highly correlated inputs were the turnover ratios and the sack rate metrics.


Specific numbers are given here, but overall, the spread was clearly the best predictor in terms of the following metrics:


  • Win/loss accuracy
  • Average error (how many points off was it?)
  • Correlation of predictions with actual result
  • Proportion of games classified as home team wins.


Using the spread as an extra input, I could get better results in one or two areas in most years, but the spread was clearly carrying the load. Support vector machines with the spread did the best overall, giving stable predictions (unlike neural networks), but they're not easily interpretable models. Linear regression without the spread was 57-63% accurate, which was on the lower end of performance, but it's a model that is easily interpretable.

Where to go from here
For interpretability issues, I'm going to be mainly experimenting with linear regression. The tradeoff in accuracy isn't worth it at this point.

If the spread's the best predictor, then I think trying to model the spread could yield some knowledge that leads toward better predictions. It's a simple matter of replacing the final score margin with the spread as the output I'm trying to predict. I'll be following up on this soon.

The bias towards the home team in all of the methods needs to be taken down a notch. In the case of linear regression, 3.2-3.6 points were being added in favor of the home team automatically (via bias term), which is up to a point more than what should be added on average. Rather than using the bias linear regression comes back with, I could use the actual average result for that year, so in 2006, when the average result was 0.84 points in favor of the home team, an extra 2 points wouldn't be added. The bias could also be adjusted for the home field climate type, eliminating the need for the binary variables.

Most importantly, better inputs are needed. All of the computing power in the world isn't going to help otherwise. From the box scores, I can also include kickoff returns and third down conversion rates. I'm also going to follow up on that soon. Other than that, I think something like Football Outsiders' DVOA statistics are necessary. The DVOA stats take the context of every play into account, filter out random noise, are adjusted for opponent quality, and break down into very specific situations and for specific players and groups of players. DVOA for the pass defense actually measures quality of the pass defense, unlike the YPG stats.

As long as this article is, I glossed over a good deal in terms of specific results. To put it shortly, we could do better. In a way, I spent several months discovering what I pretty much knew already: YPG stats aren't very valuable, warm-weather teams have trouble in cold weather. But it was nevertheless interesting to quantify things like home-field advantage (more on this coming). The research is going to need time to evolve, and my resources are limited. Can't be afraid to fail.

Read More......