Tuesday, July 31, 2007

Does Defense Matter More in the Postseason?

In Pro Football Prospectus 2006 and 2007, it is shown that defensive performance (as measured by DVOA) correlates more with playoff success than offensive performance. Similar findings have been made in baseball. As correlation is not causation, the question is why offensive performance is seemingly less important. Originally, I hypothesized that defensive performance was less consistent and needed to be better overall so that the worst performances were still good enough to win. That didn't pan out particularly well, so it was back to the drawing board. Today's hypothesis is a little more straightforward.

If offensive efficiency has a higher correlation with regular season wins than defensive efficiency, it means that the offenses in the playoffs are already very good. When everybody is good, then everyone is average. If the quality of defenses isn't as good, however, then teams with good defenses will be more successful in the playoffs.


(The test data is on the 1996-2006 seasons.)

The average efficiencies (yards per play) for playoff teams are as follows:


  • Run Off 4.1126 yards, 1.5356% VOLA (Value over League Average)
  • Run Def 4.0076 yards, 1.0906% VOLA
  • Pass Off 6.379 yards, 8.4316% VOLA
  • Pass Def 5.6086 yards, 4.6672% VOLA


So by VOLA standards, defenses of playoff teams aren't as good as the offenses. The one caveat is that there are 20+ more instances of Pass Off. VOLA above 10% and 20% than for Pass Def. VOLA. Take that as you will. It might just mean that there are a lot of crappy quarterbacks in the league weighing down the league averages and the very good QBs are also very consistent (Brady, Manning, Culpepper, Warner of the Rams, Green, Elway, Favre).

Let's take a look at the correlation coeffiecients with playoff seedings, specifically 7-seed # for playoff teams only. By the hypothesis, we'd expect the defensive eff. correlations to be higher because the offenses are all very good across the seeds.

The correlation coefficients with 7-(Seed #) listed as Offense, Defense are as follows:

  • Run VOLA .10812, .096591
  • Pass VOLA .11949, .3477
  • Sack Rate VOLA .1075, .23407
  • Third Down Conversion Rate VOLA .11549, .24107
  • Interception Rate VOLA .16219, .2013
  • Fumble Rate VOLA .0189, .16761


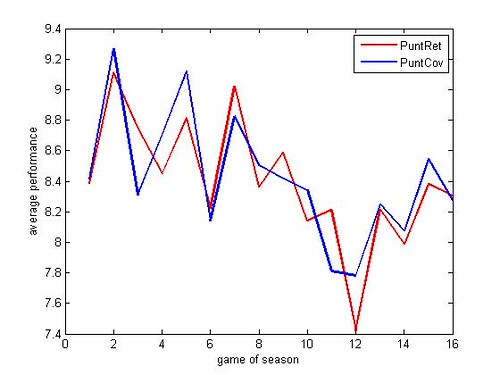
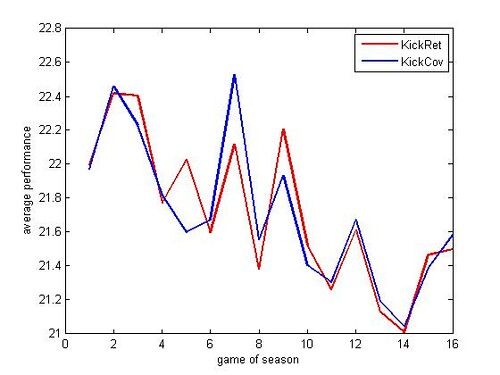
In every category except run efficiency, defensive performance has the higher correlation with playoff seeding. So defense is what sets apart the contenders from the one-and-dones. Creating turnovers is important, but a quarterback who is poor at decision-making plays an important part as well. Stopping drives on 3rd downs and forcing punts is also important. Interestingly, punt return averages have next to nothing correlation with the seeding, but kick return averages have a .18278 correlation. And although generally, none of these correlations are particularly strong, they seem to be strong relative to what you'd see in working with football data. I suspect ranking divisional winners 1, 2, 3 and now 4 cuts down on these coefficients, however.

Of course, seedings do not equal success, but seedings equal home field advantage, which does seem to play a significant part in playoff success. The following table shows the value of home field advantage for the intraconference playoff games (i.e. all games except the neutral-site Super Bowl). I've split it time-wise by the realignment of divisions, which cuts down on the sample size considerably, but there does seem to be an impact.


Avg. Result/Home Win %1996-20012002-2006
WC9.667/79.167%5.0/60%
DIV11.917/79.167%6.25/70%
CF3.0833/50%3.4/60%
OVERALL8.0303/71.212%5.1818/63.636%


Despite the seemingly larger home field advantage, it's important to note that higher seeding likely means better team. It is the defenses, however, that are making the teams "better," according to my interpretation of the data.


Avg. VOLA for Playoff Teams, 1996-2006
StatSuper Bowl WinnersSuper Bowl LosersNon-Super Bowl Winners
RO0.0225760.0285550.014699
RD0.0487160.0483320.007469
PO0.108370.112390.081933
PD0.0975420.0453390.042048
SRM0.0436730.0286130.066265
SRA0.084110.116890.12584
PR0.16781-0.00787710.020933
PC0.0408760.0100330.030548
KR0.046957-0.00242190.0095025
KC-0.02826-0.0204310.0022995
3CM0.124620.0675470.068969
3CA0.0341590.0447920.03235
PFD0.0064548-0.0537550.023301
PY0.02089-0.0216060.018493
IRG0.16230.114820.087693
IRT0.279410.0957940.053809
FRG0.0919160.0715520.11377
FRT0.190850.0956110.054136


The stats where the Super Bowl winners had a noticably higher average than the rest of the playoff teams were: Run Defense, Pass Defense, Punt Return, Third Down Conversion Rate Made, Interception Rate Given, Interception Rate Taken, and Fumble Rate Taken. Tangential but interesting: 1996 Green Bay, 1997 Denver, 2000 Baltimore, 2001 New England, and 2005 Pittsburgh had 25%+ VOLA on punt returns, while besides 2004 New England (-32.4%) and 1998 Denver (-2.16%), no Super Bowl winner had negative VOLA on punt returns. Back on point: the defensive efficiency on run and pass plays are much higher for Super Bowl teams than other playoff teams (4.87% vs. 0.007% run, 9.75% vs. 4.20% pass), but the gap in offensive pass efficiency isn't as large (10.837% vs. 8.193%). The pass offenses of playoff teams are good to begin with. Defenses of playoff teams aren't necessarily better.

Another way to look at it is who won with high VOLA and who won with low VOLA. Of the 11 Super Bowls looked at, only the 2000-2 winnners (BAL, NE, and TB) won with below average pass offense efficiency. Only the Patriots in 2001 won with below average pass defense efficiency. Of the 22 Super Bowl teams, 12 had 10%+ VOLA in pass offense (6 winners and 6 losers). In the same time frame, 73 teams had 10%+ VOLA, 59 of which made the playoffs. Eight teams had 10%+ VOLA in pass defense (4 winners and 4 losers), but only 47 teams had 10%+ VOLA in the same time frame, 34 of which made the playoffs. So 80.822% of teams with 10%+ VOLA in pass offense make the playoffs, and 16.438% of which make the Super Bowl. On the other hand, 72.34% of teams with 10%+ VOLA in pass defense make the playoffs, while 17.021% of those teams make the Super Bowl. The percentages show that a good offense will get you to the playoffs, but it needs to be balanced with a good defense in order to reach the Super Bowl.

That very good pass offenses are much more common than very good pass defenses is surprising and disconcerting. As a sanity check, I took a quick look at FO's 2006 DVOA standings. Eleven teams had 10%+ DVOA for pass offense, while only six teams had 10%+ DVOA for pass defense. The same is not true for rush efficiency. The surprising conclusion is that very good offenses are more common than very good defenses. The million dollar question is why they are more common. Perhaps offenses are easier to build because one man can make such a large difference in offenses (QB or RB), and one man cannot make such a difference in defenses. Brady never had great receivers (nor a great running back), but his skills led them to 3 Super Bowl wins. Though you might argue that Bob Sanders had a large impact last postseason as well.

Actually, the Colts also faced imbalanced teams in the 2006 playoffs. The Chiefs had an above average offense but below average defense and a worn out running back. The Ravens had a great defense but a so-so offense (6.26% Pass Off. VOLA, -17.275% Rush Off. VOLA). The Bears had a great defense but a below average offense. The only team the Colts faced in the 2006 playoffs with some amount of balance was the New England Patriots (#7 Off DVOA, #8 Def DVOA).

In conclusion, very good offenses are more common and more important to regular season wins, so playoff teams have good offenses on average to begin with. Consequently, teams with balance on both sides of the field are more likely to win.

Mind you, 11 seasons is a small sample size, but the initial results merit more research. In the future, I hope to expand on the sample size back a couple decades at the expense of dimensionality (restricted to simple rush/pass yards per play measurements) and revisit the last decade using DVOA.

Read More......

Thursday, July 26, 2007

Who's On the Rise and Who's On the Decline: Expanded and Corrected

Going over the 2007 Pro Football Prospectus, I thought I'd give a quick shot at predicting whose win totals would improve/decline next season.

I chose the linear regression model of season win totals based on Value Over League Average, training on 1996-2005, and took a look at which teams won at least X more/fewer games than their expected win totals, where X was the mean absolute error on the 2006 season (1.233 games). So the rule of thumb is that those who won ≥1.233 games less than their expected win total is expected to improve in 2007. Those who won ≥1.233 games more than their expected win total is expected to decline in 2007.


IMPROVE


  • Miami Dolphins (7.9975 expected wins, 6 actual) Very good defense with gaps in the secondary and an aging core. Offense will hopefully improve with a good quarterback (Trent Green), but the receiving corps is weak. The offensive line is also being reshuffled. Any statistical improvement will likely be regression to the mean as much as actual increase in talent.
  • Pittsburgh Steelers (9.4697 expected wins, 8 actual) Big Ben will be healthy. That should make all the difference.
  • Jacksonville Jaguars (10.432 expected wins, 8 actual) They need to settle on a quarterback because otherwise, this is a very good team. Their unadjusted VOLA for run offense and defense are 20.0084% and 16.382% (percentage above league average for yards per carry). Their pass efficiency was below average on defense, but they got a lot of interceptions (their rate was 21% above league average). I will jump on the FO bandwagon and peg them as the big sleeper of 2007.
  • Oakland Raiders (4.1932 expected wins, 2 actual) There's nowhere to go but up, right? Well, actually, their pass defense was good (9.04%, 15.775% unadj VOLA in pass eff. and sack rate made). It's just that their pass offense was far more atrocious (-27.022% pass eff., -96% sack rate allowed, a sack rate of 11.6% compared to a 6.2% league average). Don't expect them to be playoff contenders, but if JaMarcus Russell and Michael Bush are simply mediocre, this team is at least a 5 or 6-win team.
  • Philadelphia Eagles (11.294 vs. 10) If not for a freak 62-yard game winning field goal (Matt Bryant of the Bucs), the Eagles wouldn't be in this list. The Eagles might not improve their win total in 2007, depending on when McNabb is able to play effectively again. Despite the injury to McNabb, their pass efficiency was 20.58% above average in 2006. They went 1-3 against the AFC South and don't look to fare much better against the AFC East in 2007. They do, however, play the NFC North instead of the South. My intuition is that their interdivision and interconference games will be the difference between 10-6 and 13-3.
  • Detroit Lions (5.2434 vs. 3), Minnesota Vikings (8.0195 vs. 6) I don't expect them to be significantly better. I just expect the Bears to be worse.


DECLINE

  • New England Patriots (10.013 vs. 12) With a legitimate wide receiving corps (that is quickly becoming the most overrated without having played a down), I wouldn't buy into this. New England will do just fine.
  • New York Jets (8.3734 vs. 10) Their defense just isn't very good. And their passing game was average. This is a team I'd expect to regress to the mean. Thomas Jones is a good back, but I don't think that's enough to make this team a legit playoff contender.
  • Tennessee Titans (4.6593 vs. 8) When you're winning games with 62 yard field goals, you know your luck is good. But they've lost Pacman Jones, and how many times can they rely on Vince Young's scrambling ability?
  • San Diego Chargers (12.401 vs. 14) I think that this will happen with most 14 or 15-win teams. It's not that the Chargers weren't very good. They were at least 10% above average in rush offense, pass offense, and pass defense efficiency. It's just that with "luck" and scheduling, teams have to be really, really, super good for the system to guarantee at least 14 wins. That said, they play the AFC South and NFC North this year, as opposed to the NFC West and AFC North, so expect some drop off in win totals.
  • Chicago Bears (11.005 vs. 13) The Bears were lucky to play 4 games against the NFC West. Next season, their intraconference matchups will be against the NFC East, plus the Saints. A harder schedule will mean fewer victories. That said, Rex Grossman's passing efficiency was about average, and the pass defense was very good. Actually, Rex Grossman and the offensive line did a very nice job of avoiding sacks as well. Thomas Jones, according to these numbers, was overrated, as his efficiency was 8.69% below average. So was my original perception about Rex Grossman being crappy wrong? I don't think so. I think the weak schedule might have inflated his numbers somewhat (adjusted VOLA is about 0% as opposed to about +2%). I'd peg them down as an 9-7 or 8-8 team. Somebody has to win the NFC North, after all.
  • Atlanta Falcons (5.5363 vs. 7) Great offense rushing efficiency (31% VOLA) but a very bad pass offense (-14.45% VOLA). Bad pass defense too. With Joey Harrington under center, don't expect their pass efficiency to go up much, if at all. They might get some help from playing the NFC West.
  • San Francisco 49ers (5.2197 vs. 7), Seattle Seahawks (6.906 vs. 9) This is really just a result from the NFC West being a really weak division overall. The Cardinals drew the shortest straw in 2006 apparently. While Seattle also had health issues dragging down their season averages, Shaun Alexander might not recover so easily from overuse in 2005.


The numbers don't seem to add much to what we already know, but it will be interesting to see how the predictions will play out. At the end of the season, I'll pick apart the article and methods to see what went right and what went wrong. I think the running theme of the article, however, is that the quarterback is the key issue for most of these teams. For some teams, other team's quarterbacks seem to be the issue.

In short: The NFC North and NFC West are mediocre but wide-open divisions. Atlanta might miss Michael Vick, but the Falcons weren't very good before he got himself in legal trouble. The Steelers and Eagles can expect improvment with healthy quarterbacks at the helm. Jacksonville has great potential to get deep into the playoffs. Chicago is going to sink in 2007. And Tom Brady and Bill Belicheck must be pretty dang good to perform so well with Reche Caldwell and Jabar Gaffney as their receivers.

Addendum: Accuracy of Rise and Fall Projections
I went back and checked tested these rise-and-fall predictions on the 1997-2005 seasons against each selected team's win total the following season. Over those 9 seasons, 53.125% of predicted risers saw at least a 1-game increase in win totals the next season, while 62.295% of predicted fallers saw at least a 1-game decrease in win totals. Over 2002-2005 (the last realignment), however, the accuracy numbers were 65.517% and 67.742%. So the divisional realignment and new scheduling method seem to expose more teams with abnormally high or low win totals as the bad/good team they actually are.

For one more experiment, let's try projecting next season's win totals based on expected and actual wins as a simple regression model. The inputs are actualwins(Y) and expectedwins(Y)-actualwins(Y) and a bias input (always equal to 1). So the idea is that teams that outperform projections will be penalized and teams that underperform will be rewarded. The output will be actualwins(Y+1).

This model, unsurprisingly, isn't very good. The mean absolute error was 2.1299 games in predicting actual wins in 2006. The correlation coeffecients to actualwins(Y+1) are 0.26804 for actualwins(Y) and -0.0052895 for expectedwins(Y)-actualwins(Y). I was surprised to see the second coefficient close to zero. The difference between expected wins and actual wins is actually the error of the win total regression system, and that error goes both ways creating "random" noise. The error doesn't necessarily mean that team over or underperformed that season. That is only the interpretation I ascribe to it (and as a side note: I think it's important to state that statistics are merely tools. They can be poorly designed or poorly implemented. I think people are too quick to dismiss stats as excluding intangibles. That is the interpretation they've ascribed to the stats. It may or may not be true.).

The regression coeffiecients make a little more sense, however. Each win in year Y is worth 0.29507 wins in year Y+1. Each expected win a team did not get in year Y is worth 0.17917 wins in year Y+1. Each win above the expected win total in year Y is worth -0.17917 wins in year Y+1. Each team is automatically "given" 5.6739 wins (the coefficient for the bias input). For the predictions next year, I swapped out the actual wins input with expected wins in 2006. This was an inadvertent mistake on my part and not completely sound science. However, the predictions are more interesting this way. One of the weaknesses of many next-season win projections is that division rankings aren't shaken up very much, if at all. This slip-up turns out to be pretty useful because it does mix things up. All of the predicted win totals for 2007 are between 6-10 games, so the exact predictions are not very useful. The rankings, however, are useful. Here are the expected final intradivision rankings for 2007.

AFC East

  1. Miami Dolphins
  2. New England Patriots
  3. Buffalo Bills
  4. New York Jets


AFC North

  1. Baltimore Ravens
  2. Pittsburgh Steelers
  3. Cincinnati Bengals
  4. Cleveland Browns


AFC South

  1. Jacksonville Jaguars
  2. Indianapolis Colts
  3. Houston Texans
  4. Tennessee Titans


AFC West

  1. San Diego Chargers
  2. Kansas City Chiefs
  3. Denver Broncos
  4. Oakland Raiders


NFC East

  1. Philidelphia Eagles
  2. Dallas Cowboys
  3. New York Giants
  4. Washington Redskins


NFC North

  1. Chicago Bears
  2. Green Bay Packers
  3. Minnesota Vikings (1,2, and 3 are very close)
  4. Detroit Lions


NFC South

  1. New Orleans Saints (by a mile)
  2. Carolina Panthers
  3. Tampa Bay Bucs
  4. Atlanta Falcons


NFC West

  1. St. Louis Rams
  2. Arizona Cardinals
  3. Seattle Seahawks (1, 2 and 3 are very close)
  4. San Francisco 49ers


Certainly, I disagree with some of these projections, but a lot of my assumptions at the beginning of the season don't pan out, so I'll see how the numbers do.

7-30-07: I found an error in my offensive pass efficiency stats. Results and article corrected.
7-30-07: Added section to article about accuracy of this projection system.
8-27-07: Corrected NFC North order and prediction method.

Read More......

Thursday, July 19, 2007

Gone Fishin'

Just wanted to let you readers know that I'll be out of the country until the 25th, so stay tuned, and I'll have something new up by the end of the month.

Football question: Will this the week-long break kill my momentum? Will I be rusty when I return, or will I be refreshed and less likely to pull a hammy?

Read More......

Monday, July 16, 2007

Does Balance in Play Calling Matter?

If, on a given Sunday, your running game just can't get anything done, does it pay to continue calling running plays? Should you just abandon it for the passing game? Do you REALLY want Joey Harrington throwing the ball sixty-two times in a single game, Osaban Bin Lyin'? This really isn't about the running game setting up the passing game, per se. As it turns out, over 1994-2006, unadjusted pass and run (offensive) efficiency have a correlation coefficient of -0.0084705, essentially zero. They're "unrelated." Talent probably wins out. Adjusted efficiencies don't fare much better. Instead, I'm simply testing whether or not an imbalance in play calling negatively affects offensive efficiency. Ideally, on a graph where X is the ratio of pass plays called to run plays called and Y is the offensive efficiency, we'd expect a parabola peaking at 1-1, or at least something that looks like one.


Correlation of stat with percentage of plays run that are pass plays
StatisticCorr. Coef.
Run Eff, Unadj-0.19428
Run Eff, Opp Adj-0.16552
Run Eff, HF Adj-0.19233
Pass Eff, Unadj-0.24897
Pass Eff, Opp Adj-0.28482
Pass Eff, HF Adj-0.24415
Off Eff, Unadj-0.12309
Sack Rate, Unadj0.069636
Sack Rate, Opp Adj0.052371
Sack Rate, HF Adj0.066329
Int Rate, Unadj 0.13693
Int Rate, Opp Adj 0.11492
Int Rate, HF Adj 0.13295
Fum Rate, Unadj 0.19613
Fum Rate, Opp Adj 0.1806
Fum Rate, HF Adj 0.19536
Margin of Victory/Defeat-0.59146


If I check correlation with an imbalance stat (absolute value of .5 - proportion of plays called that are pass plays), the numbers aren't much different but here's a quick summary.

Run efficiencies: ~-0.11
Pass efficiencies: ~-0.14
Total offensive efficiencies: ~-0.08
Margin of victory/Defeat: -0.38188

So, play calling imbalance seems to have a negative effect on offensive efficiency, but it could just mean that losing teams, which are generally teams that aren't performing as well statistically, are forced to abandon the running game to try and catch up. And of course, teams that are winning will abandon the passing game to run out the clock. The margin of victory/defeat correlation coefficients seem to back up this theory. But I would hardly say that the numbers are conclusive. Take a look at the graphs. I've included only 2 of the charts for brevity's sake and just to get an idea of how much they do not look like parabolas.


They're essentially blobs with some vague direction. This is the face of low correlation. I'd like to revisit this article later on with finer grained data. Once I collect some play-by-play data (hopefully the NFL.com gamebooks won't be too hard), I plan on breaking down this data by quarter/half or scoring margin, to see how ability and game plans affect the results rather than how results affect the game plan.

Read More......

The Predictive Ability of Averages

The predictions made by my and others' models are simply an expected level of performance given the averages. In other words, if this game were played an infinite number of times, we'd expect the average result to converge towards this number. Players don't play at the mean, however. They play above and below it. On any given Sunday, numerous unpredictable factors can influence performance levels and thus the outcome. Weather, in-game injuries, the coaches' playcalls, bad seafood, a scorned woman (e.g. Mrs. Nick Harper), a player soliciting prostitution from a cop, a player soliciting prostitutes for opposing players. Over time, however, these factors should balance themselves out, and everything but ability should be filtered out of the averages. So how predictive of the next week's performance are the averages?


To find out, I took the to-date averages of weeks 3-16 for the years 1996-2006 and matched them up with the in-game averages from weeks 4-17 of the same years. This matches up with my testing methods for the prediction models except I'll start making predictions for week 3. You can't really expect to make good predictions based off 1 or 2 weeks of data, however. So the test is how well do averages based on weeks 1 through W-1 correlate with the results in week W?


Correlation coefficients of averages up to week W-1 with performances in week W
StatUnadj.Adj. for Opponent
RO0.146470.15258
RD0.0912640.11125
PO0.16958 0.1335
PD-0.00132360.069243
SRM0.0289810.036354
SRA0.233580.22261
PR0.0263460.023044
PC0.0635920.066901
KR0.0488250.030787
KC0.0397680.0099349
3CM0.127930.12153
3CA0.0668260.060486
PFD0.0484450.052096
PY0.0887830.083038
IRG0.000466380.0038317
IRT0.0460330.025835
FRG0.0587330.039033
FRT0.0232680.002728


Here we see a fundamental problem with the prediction models: Players don't play at their mean level, and thus, the averages aren't terribly predictive of performance within a single game. Even adjusting for performance doesn't really help. The yards per carry and yards per pass attempt stats are highly dependent on down-and-distance and current scoring margin situations. Busted plays might cause huge shifts in "momentum," as Marcus Allen's 74-yard TD run and Joe Thiesmann's pre-halftime pick six in Super Bowl XVIII did. And if Don McNeal hadn't slipped as he stopped following the receiver in motion, maybe he would have tackled John Riggins for a 2-yard-gain instead of letting him break off a 43-yard TD run, and the Dolphins would have won Super Bowl XVII. Little things like that greatly affect the in-game averages. Excluding that one play, Riggins averaged 3.324 yards on 37 carries, not a particularly good performance against a poor run defense (4.38 yards/carry allowed). Considering that he had a paltry 3.1 yards/carry that season, the odds of him getting that one long play were probably very small. But the play call by Gibbs put McNeal in the position to slip up. Was it luck? I wouldn't say that. Actually, reading up on the 2006 Cardinals in Baseball Prospectus, I came across this fitting quote: "Luck is the residue of design." Was it a repeatable event with predictive value? I have my doubts.

So happenstance can make the statistics more retrodictive than predictive, judging by the correlations with next-game scoring margins, next-game averages, and with season win totals. Sixteen games doesn't seem to be a large enough sample size to filter out all of the happenstances from the stats.

Read More......

Friday, July 13, 2007

The Value of Home-Field Advantage 4.0 - Performance Enhancement

The regression models tend to put stronger coefficients on the home team performance variables than on the away team's variables. This contributes to the overly strong home-team bias of the regression models. But because of the training error-minimizing nature of the regression, you can't really tinker around with the coefficients and expect improved results. More mathematically sound methods of dampening the weights (e.g. ridge regression) have not really improved accuracy either. Given that, I tried to fix the bias in the coefficients by fixing the bias in the data.

If the home team is winning 58% of all games, then it's reasonable to assume that being at home influences a team's offensive, defensive and special teams efficiencies. When trying to judge a team's performance mid-season, they have not necessarily played as many home games as away games. So how much bias would that cause? Does adjusting performance based on home-field advantage create more informative stats?


The table below shows the average of year-end league averages in several metrics split according to performance at home and on the road.


Avg. Performance of League, 1996-2006
StatHomeAway
Run Eff.4.1033.9956
Pass Eff.6.01515.7526
Sack Rate Allowed6.5962%6.9897%
Punt Ret.9.52889.1585
Kick Ret.22.08421.479
3rd Down Conv.38.656%37.005%
Pen. 1st Downs Given1.6671.5091
Pen. Yds. Given52.25755.936
Int. Rate2.8441%3.1675%
Fum. Rate3.1435%3.1924%


As expected, home teams are consistently better, but the scale of those differences is small. The difference is run efficiency amounts to an extra 2 yards for every 30 attempts. For pass efficiency, it amounts to an extra 8 yards for every 30 attempts. The difference in interception rates doesn't even amount to a tenth of an interception for every 30 pass attempts. Yet these differences are somehow worth 2.7857 points to the home team and a 58.941%/41.509% split of games.

So to adjust stats for home field advantage, I used the same method as opponent adjustments. Instead of adjusting by the ratio of league average to opponent average, I use the ratio of league average to home/away average. In terms of season win totals, adjusting for home-field advantage increased the R2 of the model (1996-2006 data) from 0.728 to 0.764. Adjusting the stats for home-field advantage does improve the statistics. Unfortunately, it does not significantly alleviate the problem of regression models classifying too many games as home team wins (a 1-2% decrease, still above 70%).

Read More......

Thursday, July 12, 2007

Consistency of Offensive and Defensive Efficiency Part I - Regular Season

Looking at the correlations of the stats to regular season win totals, offense seems to be more important than defense to winning. For example,


  • Rush offense efficiency: 0.2052
  • Rush defense efficiency: -0.13296


However, Football Outsiders did a study that showed that defense was more important to postseason success. This seems to fall in line with the 2002-6 Colts. And the same pattern can be found in baseball, where pitching metrics (especially for relievers) become the most highly correlated to playoff success (Baseball between the Numbers). But correlation does not equal causation. Why does offense suddenly drop in importance?

With the the single elimination playoffs, the better team does not always necessarily win. Teams never perform at their absolute average, which makes predicting wins through teams' average performance fairly difficult. The Jaguars by a fair share of metrics perform really well on average, but it hasn't translated to a great record because of their inconsistency. Over one game, anything can happen. So the team that gets deeper into the playoffs should be reliable and consistent.

If defense is the better predictor of postseason success, then is defense more consistent from game to game? Over a 16 game sample, if it is more consistent, then because the outcomes of games are so varied, the more consistent defensive metrics are more lowly correlated with win totals. Or an alternative hypothesis might be that because defensive performance is less consistent, that you need a very good defense, for whom rock bottom isn't that bad, to overcome the consistently excellent offenses in the playoffs. From year to year, defensive efficiency changes more than offensive efficiency (according to FO), so more week-to-week inconsistency would be reasonable to expect. Let's take a look at what the numbers have to say.


Correlation of week's performance with next week's performance, Unadjusted for opponent
StatCorr. Coef.
RunOff0.08295
RunDef0.039186
PassOff0.17349
PassDef0.010152
SackRateMade(Def)0.01733
SackRateAllow(Off)0.18595
3rdDownOff0.071573
3rdDownDef0.011514
IntRateGiven(Off)-0.012781
IntRateTaken(Def)0.01926
FumRateGiven(Off)0.025166
FumRateTaken(Def)0.025957


Average in-season standard deviation of metric, Unadjusted for opponent
StatAvg. Std. Dev.
RunOff1.1732yds
RunDef1.1885yds
PassOff1.8195yds
PassDef1.8962yds
SackRateMade(Def)4.919%
SackRateAllow(Off)4.6111%
3rdDownOff13.096%
3rdDownDef13.405%
IntRateGiven(Off)2.9114%
IntRateTaken(Def)2.8889%
FumRateGiven(Off)2.7177%
FumRateTaken(Def)2.7259%


According to these methods using the unadjusted-for-opponent stats, defensive performance is less consistent than offensive performance (except maybe with turnovers). The differences between the average std. deviations of the offensive and defensive metrics are small, but they are at least consistent in favor of offense. The differences in correlation coefficients are more significant. Surprisingly, the week-to-week correlation of defensive performance is near zero. The performance of defense one week seemingly has no bearing on performance the following week whatsoever. And momentum is, at best, a small factor on offensive performance, which apparently doesn't matter as much in the playoffs anyway. Much of this variance likely has to do with the opponents, so now is the time when we adjust for opponents.


Correlation of week's performance with next week's performance, Adjusted for opponent
StatCorr. Coef.
RunOff0.095318
RunDef 0.052455
PassOff0.13248
PassDef0.026777
SackRateMade(Def)0.022664
SackRateAllow(Off)0.17386
3rdDownOff0.071013
3rdDownDef0.017221
IntRateGiven(Off)-0.0048146
IntRateTaken(Def)0.010823
FumRateGiven(Off)0.018135
FumRateTaken(Def)0.024204


Average in-season standard deviation of metric, Adjusted for opponent
StatAvg. Std. Dev.
RunOff1.1083yds
RunDef1.1073yds
PassOff1.9546yds
PassDef1.7601yds
SackRateMade(Def)4.6508%
SackRateAllow(Off)4.5034%
3rdDownOff12.682%
3rdDownDef12.788%
IntRateGiven(Off)2.9403%
IntRateTaken(Def)2.9135%
FumRateGiven(Off)2.6759%
FumRateTaken(Def)2.6853%


As it turns out, adjusting for opponents closes the gap a little, but offense is still more consistent overall. Adjusted for opponent, rush pass off. eff. have more variance than their defensive counterparts, but the week-to-week correlation is still well in favor of the offense.

Three out of the four tests I ran say that offensive performance is actually more consistent than defensive performance. So the conclusion seems to be that the defense needs to be very good so it can matchup okay with the consistently good offenses of playoff teams, even when they're not performing at their optimum. Does this reasoning make sense to anyone else? Definitely a topic for further exploration/discussion.


Addendum: Reply to bettingman's post
Do defenses adapt over the season and improve? Makes sense as they have to react to the offense. I just threw together these graphs. It's by game rather than week, so the two rates won't exactly sync up.


Rushing offense improves over the year by about .2 yards/attempt, but passing offense worsens over the year by about .2 yards/attempt. Sack rates don't trend either way, but interception rates increase by about .3%. So the passing game does indeed become less effective as the year progresses. The improvement in the rushing game might stem from defenses focusing more on the passing game. Also of note, kick and punt return averages decrease over the season but start to pick up again towards the end of the season. Clearly, special teams do a good job of adapating their return coverages. Do the return units start to adapt to the coverages as well?


Read More......

Disclaimer on Data

I've been culling my box scores from this site as it was the deepest archive of box scores I could find when I started the research. Since then, I've found DatabaseFootball.com to supplement some of the information and correct errors. DF's archives go back to '83, but the other site has more third down conversion data. At any rate, I was working on an article about game-to-game variance of offense and defense, and I started to realize that there are more errors than I originally realized. They're just small typoes, but if you enter 75.0 rushing yards as 750 yards, it tends to throw off my metrics. So I'm looking at all the curiously aberrant data and correcting any mistakes. Maybe I should start putting a warning label on my site: May not be 100% accurate.

This was fixed quicker than I thought. Here is what I corrected today:


  • 2003 Week 15 SF@CIN Rushes 3->37
  • 1994 Week 14 PIT@CIN Rush yards 768->76
  • 2004 Week 2 NYJ@SD Rush yards 1222->122
  • 1995 Week 6 MIN@HOU Rush yards 750->75
  • 1994 Week 6 PHI@WAS Sacks ->2-15 3-39
  • 1994 Week 2 NYG@ARI Sacks 3-23 14-27 -> 4-31 3-23
  • 2006 week 11 PIT@CLE PIT Kick Returns 1-158->5-158
  • 2006 Week 15 TEN@JAX JAX Kick returns 3-417->4-117
  • 2000 Week 3 STL@SF Third Down 10-2 9-4 -> 2-10 4-9
  • 2000 Week 3 BUF@NYJ Third Down 13-6 17-6 -> 6-13 6-17
  • 2000 Week 3 PHI@GB Third Down 15-5 13-5 -> 5-15 5-13
  • 2000 Week 3 ATL@CAR Third Down 16-3 12-4 -> 3-16 4-12
  • 2001 Week 1 OAK@KC Third Down 20-12 -> 12-20
  • 2002 Week 3 KC@NE Thrid Down 89-17-> 8-17
  • 2003 Week 14 PIT@OAK Fumbles 33->3


Note that these are not the only box scores I have had to correct. Out of the 3211 boxscores I have collected from John Troan's site, about 30-40 have needed to be corrected. It's an error rate of about 1%, and the most egregious errors have been taken care of. Kick return avgs. above 110 yards. Third down conversion rates over 100%. 80 yards per carry in a game. 88% fumble rates in a game. As I find more errors in my data, I will post it on the blog. Good night, and good luck.

Read More......

Tuesday, July 10, 2007

Creating Power Rankings

Just as a lark, I figured I'd try devising some power rankings using my model. The basic idea behind them is this: If every team played each other once at home, once at away, who would win the most?

I tested this idea on the 2006 teams after the end of the regular season. Using my adj. rush, adj. pass, sack, adj. 3rd down conv., and turnover data, I trained a linear regression predictor on all games before 2006. Then I used the model to predict the outcomes of all 992 possible games. I created 2 separate rankings: one based on the sum of margins of victory/defeat, one based on the expected winning percentage.


RankTeamSum of Exp. Margins
1PHI4.2027
2SD4.1368
3BAL3.8437
4JAX3.2917
5DAL2.1643
6CHI2.1514
7PIT1.9942
8NO1.8954
9IND1.7482
10NE1.5237
11MIN1.1935
12CAR1.1847
13ATL0.94039
14NYG0.84285
15MIA0.82191
16GB0.71736
17CIN0.52797
18DEN0.33802
19KC0.29031
20SF-0.685
21WAS-1.0359
22STL-1.4769
23NYJ-1.5889
24SEA-2.0378
25BUF-2.3402
26TEN-2.4492
27TB-2.8237
28ARI-3.2092
29DET-3.6094
30OAK-3.7756
31HOU-3.8764
32CLE-4.9007


RankExp. Win %Team
1tBAL0.83871
1tPHI0.83871
3SD0.80645
4JAX0.72581
5tCHI0.66129
5tNO0.66129
7NE0.64516
8tDAL0.62903
8tCAR0.62903
10tPIT0.6129
10tIND0.6129
10tMIN0.6129
13tMIA0.59677
13tATL0.59677
15NYG0.58065
16GB0.56452
17tCIN0.54839
17tDEN0.54839
17tKC0.54839
20tSTL0.43548
20tSF0.43548
22tNYJ0.41935
22tWAS0.41935
24SEA0.33871
25TEN0.32258
26BUF0.27419
27tOAK0.19355
27tARI0.19355
29tCLE0.17742
29tHOU0.17742
29tDET0.17742
29tTB0.17742


Looking at the bottom, it's about what you'd expect. Seattle, a playoff team, shows up at #24 in both rankings, but they were 8-8 in a weak division and suffered some losses due to injury and free agency. The Jets, another playoff team, show up at #23 and #22 respectively due to weak rushing offense and defense and average passing offense and defense. Seattle and the Jets were #25 and #19 respectively in Football Outsider's 2006 DVOA rankings. Philadelphia, despite a 10-6 record, shows up at #1 with a very strong offense (14.721% VOLA rushing, 20.58% passing unadj.). Jacksonville also obtains a very high ranking (#4) despite its record, a mediocre 8-8, thanks to well above average rush offense and defense. New England is a little low compared to DVOA (#10 and #7, #5) with average and below average YPA numbers but high sack and interception rates. The Super Bowl champion Colts are at #9 and #10 (DVOA #7) with 20.142% VOLA in pass offense and 26.09% VOLA in pass defense(!too high!) but -28.29% VOLA rush defense.

So overall, the rankings turn out very similar to the DVOA rankings with individual teams gaining or losing a couple spots. There are no major disparities, however, that I can see, except maybe Dallas showing up too high in the ranking by points. It would be interesting to calculate these rankings over the season and compare these with other rankings.

Figures and article corrected on 7/12/2007 after finding errors in some box scores.

Read More......

Thursday, July 5, 2007

Refining the Model Episode II - Attack of the Current Inputs

To bring things up to speed: the following table lists the current subset of possible inputs that have the best correlation with the final score margin and provide the best predictions. If you are a careful enough reader, you'll notice some new inputs, which I'll explain in a second. All of the inputs are expressed in terms of value over league average, which is a percentage.

Abbreviation key:
H = Home, A = Away, O = Offense, D = Defense, M = Made, A = Allowed, G = Given, T = Taken
R = Rush, P = Pass, SR = Sack Rate, 3C = Third down conversion rate, IR = Interception rate, FR = Fumble rate
v = versus (Home VOLA - Away VOLA)
U = Unadjusted, A = Adjusted for opponent quality (relative to league average)


Unadj/AdjInputCorrelation with Margin
AHROvARD0.12565
AAROvHRD-0.070102
AHPOvAPD0.20396
AAPOvHPD-0.17716
UHSRMvASRA0.12016
UASRMvHSRA-0.12116
UH3CMvA3CA0.17253
UA3CMvH3CA-0.12753
UHIRGvAIRT0.076802
UAIRGvHIRT-0.13572
UHFRGvAFRT0.11939
UAFRGvHFRT-0.10935


As you can see, the passing stats are now more highly correlated with the margin than the running stats. NFL Stats pointed out that yards per attempt statistics are more significant than yards per game stats. Also, a yards-per-pass attempt stat should include the yards lost in sacks. I'll get to some of the correlations of my inputs with win totals at the end of the post, as they back up those assertions.

Without getting into gross detail, using VOLA instead of raw stats bumped up the correlation coefficients slightly but consistently, and adjusting for opponent quality significantly increased the correlation coefficients for rushing and passing inputs. It's interesting to note that the home team's quality is more important (in terms of the correlation) than that of the away team. In the turnover stats, the home team's ability to pick off passes is more important than their own QB's ability to not throw interceptions. Similarly, their passing game and rushing game is more important than those of the away team. This could be another effect of teams simply performing better at home and another justification for adjusting stats to account for home field advantage. That article will come some time next week.

Since May, I've made the following changes to the data set:

  • No more punt return data. Too lowly correlated.
  • Tried kickoff return data. Same problem.
  • Penalty first downs given to opponent and penalty yards lost. Per game. Same problem.
  • Third down conversion data. Being able to sustain drives by converting third downs is, of course, important. And 3rd down attempts are frequent enough to justify adding an input, unlike fourth downs attempts.
  • Rushing stats are based on yards per carry. Adjust for opponent in similar fashion to sack rates (adjusting rate/average based on league average rather than totals).
  • Passing stats are now yards per attempt but yards lost on sacks are no longer added back to totals.
  • Instead of a broad turnover ratio, I'm using interception rates and fumble rates. As it turns out, a stat of the combined VOLAs of the inputs listed in the table above has a .13 correlation coefficient, about as high as the turnover ratio. Like sack rates, it makes more sense to judge a team by how often they throw picks rather than how many they throw.


Correlation Coefficient of Year-End Stats with Season Win Totals
StatUnadj RawUnadj VOLAAdj RawAdj VOLA
RO0.20520.210760.209910.21529
RD-0.132960.1418-0.114690.12303
PO0.58750.593690.617530.62381
PD0.12777-0.12764-0.440510.44867
SRM0.294530.306830.258530.27186
SRA-0.358120.36049-0.334230.33633
PR0.149760.150240.124540.12407
PC-0.106930.10282-0.101790.09751
KR0.0801390.0822330.0299620.030679
KC-0.0511890.050584-0.0528030.053027
3CM0.49480.500870.476610.48294
3CA-0.337920.34373-0.276120.2809
PFD-0.0908830.090432-0.0616340.060372
PY-0.114650.1219-0.108170.11399
IRG-0.380330.38235-0.361970.36454
IRT0.346520.35130.289930.29535
FRG-0.43070.43468-0.374160.37877
FRT0.349380.351410.327980.33012


PR = Punt Return, PC = Punt Coverage (yards per punt return), KR = Kick Return, KC = Kick Coverage (yards per kickoff), PFD = Penalty First Downs, PY = Penalty Yards

Using unadjusted sack, punt, kick, penalty, and turnover data along with adjusted rush, pass, and third down conversion data, the model has an average R2 of 0.7995 and average mean absolute error of 1.38 wins. The predicted win totals have a correlation coefficient of 0.83151 with the actual win totals.


Where to Go from Here/A Preview of Upcoming Work

  • Better special teams stat. I was thinking of using average starting field position after punts and kickoffs, which I can get from NFL.com's game books.
  • Try a penalty rate stat. This would have to include all defensive plays as well. How often does a team make a mental mistake and how costly is it overall?
  • Try to adjust stats to account for home field advantage.
  • Try to adjust stats for conference.
  • Retry climate variables. Perhaps a ternary variable for each climate matchup. 0=N/A. 1=Applicable. During weeks 1-8. 2=Applicable. During weeks 9-17.


Numbers corrected on 7/12/2007 after finding errors in some box scores.

Read More......

Refining the Prediction Model Part I - Linear vs. Logistic Regression

Recently, I came across NFL Stats, a blog similarly focused on predicting football games. Somehow, Brian, the creator, was able to achieve 63% accuracy on 2006. So I'm going to be playing catch-up for a while. Let's take a look at what separates are two systems, won't we? The biggest difference between our two systems is that he uses logistic regression for simple win/loss predictions rather than linear regression. Logistic regression tries to fit a probability distribution function between two or more classes, so the output is discrete rather than continuous.

Plugging my current dataset (as will be described in the next article) into a logistic regression model, I achieve 61.789% accuracy on average from 1997-2006, a slight uptick compared to linear regression (61.547%). The original idea behind using linear regression was that the better a team was than their opponent, the higher the margin would be in their favor. In logistic regression, we'd expect the predicted probability of winning to increase proportionally to the quality gap between two teams. So as it turns out, the predicted probabilities of winning are almost as highly correlated with the final score margin (.28357) as the predicted margins of linear regression (.28617). In this case, the predicted P(win) might be used to determine whether or not to bet on a team against the spread. Logistic regression did slightly worse in terms of classifying too many games as home team wins (76.098% to 73.672%).

R2 measures the variability in a data set (i.e. the final score margins) accounted for by a model (i.e. the input data). Unfortunately, the R2 for the linear regression model is .13813 on average. Less than 14% of the variance is accounted for by the model. NFL Stats uses this measurement in the context of how their model predicts season win totals (i.e. do the expected win totals match up with the actual win totals). From 1997-2006, the R2 for my model of VOLA stats after week 17 predicting season win totals was .80287. From 2003-2006, the R2 is .82432. For NFL Stats, the R2 is 0.85 now, I believe, though it was .75 not too long ago. So I am not completely off track with my stats. In fact, the expected win totals for 2006 were off only by 1.3085 games on average, down from 1.3523 in 2005. (San Diego, Baltimore, Indianapolis, and New England all outperformed their expected win totals in 2006.)

Originally, I said that predicting exact final scores was nearly impossible because so many non-predictable factors went into the final score. Perhaps, if even the spread is off by 10 points on average, then the final score margin is determined by enough non-predictable factors that make the problem overly difficult. From now on, I'll be testing logistic regression in addition to linear regression.

Note: For the article, I used glmval and glmfit in MATLAB to do logistic regression with a binomial model.

Read More......

Sunday, July 1, 2007

The Value of Home Field Advantage Part 33 1/3: Interconference Games

One question that's been bugging me for the last few months is why home teams did so well in 2005 and so poorly in 2006. When you consider the Saints home games in 2005, the numbers seem even stranger. Is the variance for all types of matchups, or is there one specific type of matchups that has more inherent variance? Since 2002, when the league expanded to 32 teams, the scheduling for the NFL became very simplified with 16 teams in each conference and 4 teams in each division. Now, each team in the AFC plays the teams in one division of the NFC once every four years and vice versa. So interconference schedules for each team changed drastically in terms of opponent quality and regions of the country visited (and thus climates experienced). The same holds true, though to a lesser extent, for intraconference, interdivision play, as teams still have to play at least one team from each other division within the conference a year.

So the hypothesis is as follows: The scheduling procedure implemented by the NFL since the league's expansion to 32 teams has made home field advantage less stable from year-to-year, increasing the varaince of home team winning percentage and average result (home team points - away team points). Interconference games have the most year-to-year variance, followed by interdivisional games. Intradivisional games should have the least variance. The interconference games are largely responsible for the aberrant numbers for the 2005 and 2006 seasons.


Home Win % (mean/std. dev.)InterconferenceInterdivisionIntradivision
1994-200159.199/4.7460.466/4.4258.137/3.57
2002-200660.625/7.1956.875/2.4056.25/2.21
Avg Result
(mean/std. dev.)
InterconferenceInterdivisionIntradivision
1994-20013.0489/1.85852.0519/0.9102.7675/1.228
2002-20062.6875/2.59922.9896/0.8242.0354/0.816


As predicted, the standard deviation for home team winning percentage increased overall, but by category, only the standard deviation for interconference games increased, though it did so significantly. Before the realignment in 2002, each division had 4 or 5 or 6 teams, so the number of intradivisional games played by each team was not always even. Even in 1995-1998, when each of the six divisions had five teams, interdivisional games were tougher to schedule. Of the 8 non-intradivisional games, 4 were interconference, and 4 were interdivisional, meaning no team would be playing against every team in any other division. So for example, though the AFC East might be matched up with the AFC Central, the Bills might get an easier schedule against than the Dolphins because the Bills get to play the Bengals. The scheduling might also have been tooled around with to give worse teams easier schedules, resulting in some teams not meeting each other for many years, whereas the new system guarantees that won't happen. The closer teams are in quality, the more variance one would expect in the outcome. Therefore, it makes sense that the new scheduling formula decreases variance for interdivision and intradivision games.

Nevertheless, in both time periods, variance was highest for interconference games, followed by interdivision games and then intradivision games. Suprisingly, home field advantage seems to have lost some value since the realignment. Fewer games are won by the home team and by fewer points. With fewer teams in the division, intradivisional games might involve more parity and thus more variance in outcomes. The slight uptick in home team winning percentage for interconference games might have to do with the imbalance between the conferences. Though fewer interdivisional games are won by the home team, the average result has increased in favor of the home team by nearly a whole point. The converse is true for interconference games. In both cases, I'm not really sure why that happens with the average result. At any rate, home field advantage ain't what it used to be, so I might have to go back and rerun experiments training only on 2002 and beyond.


All GamesInterconference
YearGamesHome Win%Avg ResultGamesHome Win%Avg Result
19942240.571431.4598520.519230.05769
19952400.62.025600.653.0667
19962400.620833.7208600.63.4833
19972400.604172.7958600.616673.9167
19982400.629173.5042600.616673.4333
19992480.596773.0645600.566672.1167
20002480.556452.8226600.633336.4833
20012480.552422.0444600.533331.8333
20022560.578132.2461640.656253.9375
20032560.613283.5313640.656254.125
20042560.566412.5078640.56252
20052560.589843.6484640.656254.9219
20062560.531250.84766640.5-1.5469
InterdivisionIntradivision
YearGamesHome Win%Avg ResultGamesHome Win%Avg Result
1994680.647063.38241040.548080.90385
1995600.566671.31200.591671.8667
1996600.633332.21200.6254.6
1997600.616671.43331200.591672.9167
1998600.666672.61671200.616673.9833
1999580.603453.13791300.607693.4692
2000580.551721.25861300.523081.8308
2001580.551721.08621300.561542.5692
2002960.541672.1563960.56251.2083
2003960.604173.7083960.593752.9583
2004960.572923.0833960.56252.2708
2005960.572923.8646960.56252.5833
2006960.552082.1354960.531251.1563


Now, let's look at how the numbers break down by season. In 2005, although 58.98% of games are won by the home team, which is about average, the average result is very high at 3.6484. Only 1996 had a higher average result, so it's at the extremes of what's been observed before. The interconference games had an average result of 4.9219. On average, the home team won those games by nearly 5 points, which is very high, but it is still within what has been observed before. In 2000, the average result was 6.48333. The average result of interdivisional games was the highest in 2005 at 3.8646, while the home field advantage in intradivisional games was slightly below average that year. In 2006, interconference games made all the difference. Only 50% of the games were won by the home team, but the average result was actually in favor of the away team at -1.5469. The numbers for the intraconference games, while well below average, did not set any record lows. Given this data, it is reasonably safe to say that the year-to-year variance in home field advantage is largely due to interconference games.

In theory, what's happening is that as interconference matchups are rotated, strong teams are getting matched up with weak opponents. So some of this variance should be predictable. In 2006, only 40.63% of home teams in interconference games had better records than their opponents in the previous season. In 2002-2005, the numbers were 46.88%, 48.44%, 43.75%, and 43.75% respectively. The correlation of this stat to the proportion of interconference games won by the home team in that year is very strong, 0.82427, though 2005 was still better than expected, given 2004. Five data points is too small to reasonably use linear regression, but we can still take a guess at how 2007 will turn out. It turns out that the 2007 stat matches 2003 at 48.44%, so expect home field advantage to return to at least normal levels in 2007.

So how does a prediction system like the spread handle interconference and interdivision games? Since 2002, the spread has had 63.75%, 63.96%, and 66.25% accuracy on interconference, interdivision, and intradivision games respectively, while the home team was favored in 67.50%, 68.54% and 65.83% of those games. The standard deviations of percentages of favorites being home teams are 4.65%, 2.16%, and 2.74%. So the spread does seem to be sensitive to the variance but not strong enough. If similar numbers hold for my linear regression model, then perhaps better opponent adjustments are needed. Given that 75% of the season is played intraconference, I'm wondering if stats should be adjusted based on conference averages rather than league averages. I know they do similar things for baseball. It's something I'll tinker around with in the future. In short, I just traveled a long, long road for a maybe. As usual, answering one question led to several new questions popping up.

Read More......