Consistency of Offensive and Defensive Efficiency Part I - Regular Season
Looking at the correlations of the stats to regular season win totals, offense seems to be more important than defense to winning. For example,
- Rush offense efficiency: 0.2052
- Rush defense efficiency: -0.13296
However, Football Outsiders did a study that showed that defense was more important to postseason success. This seems to fall in line with the 2002-6 Colts. And the same pattern can be found in baseball, where pitching metrics (especially for relievers) become the most highly correlated to playoff success (Baseball between the Numbers). But correlation does not equal causation. Why does offense suddenly drop in importance?
With the the single elimination playoffs, the better team does not always necessarily win. Teams never perform at their absolute average, which makes predicting wins through teams' average performance fairly difficult. The Jaguars by a fair share of metrics perform really well on average, but it hasn't translated to a great record because of their inconsistency. Over one game, anything can happen. So the team that gets deeper into the playoffs should be reliable and consistent.
If defense is the better predictor of postseason success, then is defense more consistent from game to game? Over a 16 game sample, if it is more consistent, then because the outcomes of games are so varied, the more consistent defensive metrics are more lowly correlated with win totals. Or an alternative hypothesis might be that because defensive performance is less consistent, that you need a very good defense, for whom rock bottom isn't that bad, to overcome the consistently excellent offenses in the playoffs. From year to year, defensive efficiency changes more than offensive efficiency (according to FO), so more week-to-week inconsistency would be reasonable to expect. Let's take a look at what the numbers have to say.
| Correlation of week's performance with next week's performance, Unadjusted for opponent | |
| Stat | Corr. Coef. |
| RunOff | 0.08295 |
| RunDef | 0.039186 |
| PassOff | 0.17349 |
| PassDef | 0.010152 |
| SackRateMade(Def) | 0.01733 |
| SackRateAllow(Off) | 0.18595 |
| 3rdDownOff | 0.071573 |
| 3rdDownDef | 0.011514 |
| IntRateGiven(Off) | -0.012781 |
| IntRateTaken(Def) | 0.01926 |
| FumRateGiven(Off) | 0.025166 |
| FumRateTaken(Def) | 0.025957 |
| Average in-season standard deviation of metric, Unadjusted for opponent | |
| Stat | Avg. Std. Dev. |
| RunOff | 1.1732yds |
| RunDef | 1.1885yds |
| PassOff | 1.8195yds |
| PassDef | 1.8962yds |
| SackRateMade(Def) | 4.919% |
| SackRateAllow(Off) | 4.6111% |
| 3rdDownOff | 13.096% |
| 3rdDownDef | 13.405% |
| IntRateGiven(Off) | 2.9114% |
| IntRateTaken(Def) | 2.8889% |
| FumRateGiven(Off) | 2.7177% |
| FumRateTaken(Def) | 2.7259% |
According to these methods using the unadjusted-for-opponent stats, defensive performance is less consistent than offensive performance (except maybe with turnovers). The differences between the average std. deviations of the offensive and defensive metrics are small, but they are at least consistent in favor of offense. The differences in correlation coefficients are more significant. Surprisingly, the week-to-week correlation of defensive performance is near zero. The performance of defense one week seemingly has no bearing on performance the following week whatsoever. And momentum is, at best, a small factor on offensive performance, which apparently doesn't matter as much in the playoffs anyway. Much of this variance likely has to do with the opponents, so now is the time when we adjust for opponents.
| Correlation of week's performance with next week's performance, Adjusted for opponent | |
| Stat | Corr. Coef. |
| RunOff | 0.095318 |
| RunDef | 0.052455 |
| PassOff | 0.13248 |
| PassDef | 0.026777 |
| SackRateMade(Def) | 0.022664 |
| SackRateAllow(Off) | 0.17386 |
| 3rdDownOff | 0.071013 |
| 3rdDownDef | 0.017221 |
| IntRateGiven(Off) | -0.0048146 |
| IntRateTaken(Def) | 0.010823 |
| FumRateGiven(Off) | 0.018135 |
| FumRateTaken(Def) | 0.024204 |
| Average in-season standard deviation of metric, Adjusted for opponent | |
| Stat | Avg. Std. Dev. |
| RunOff | 1.1083yds |
| RunDef | 1.1073yds |
| PassOff | 1.9546yds |
| PassDef | 1.7601yds |
| SackRateMade(Def) | 4.6508% |
| SackRateAllow(Off) | 4.5034% |
| 3rdDownOff | 12.682% |
| 3rdDownDef | 12.788% |
| IntRateGiven(Off) | 2.9403% |
| IntRateTaken(Def) | 2.9135% |
| FumRateGiven(Off) | 2.6759% |
| FumRateTaken(Def) | 2.6853% |
As it turns out, adjusting for opponents closes the gap a little, but offense is still more consistent overall. Adjusted for opponent, rush pass off. eff. have more variance than their defensive counterparts, but the week-to-week correlation is still well in favor of the offense.
Three out of the four tests I ran say that offensive performance is actually more consistent than defensive performance. So the conclusion seems to be that the defense needs to be very good so it can matchup okay with the consistently good offenses of playoff teams, even when they're not performing at their optimum. Does this reasoning make sense to anyone else? Definitely a topic for further exploration/discussion.
Addendum: Reply to bettingman's post
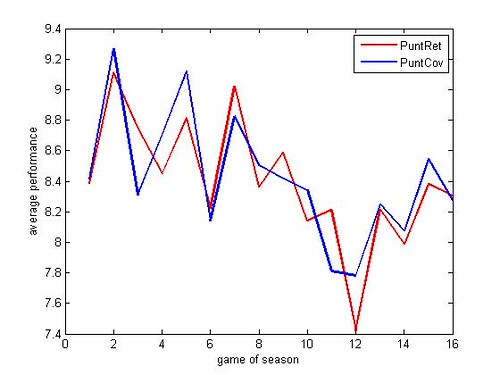
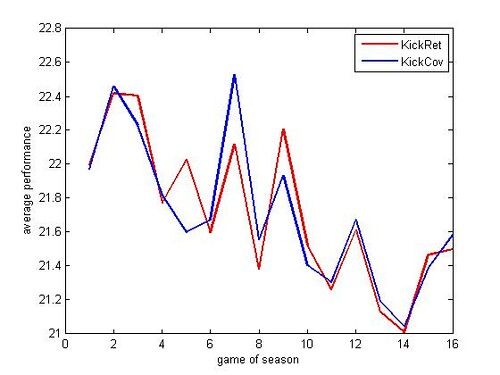
Do defenses adapt over the season and improve? Makes sense as they have to react to the offense. I just threw together these graphs. It's by game rather than week, so the two rates won't exactly sync up.
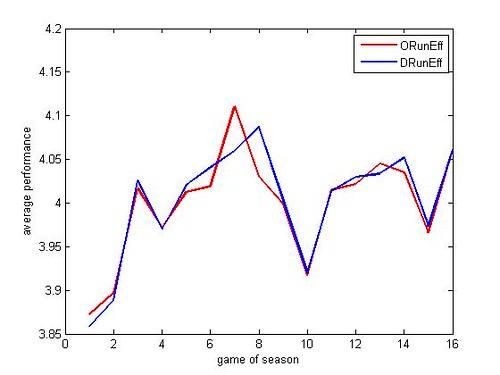
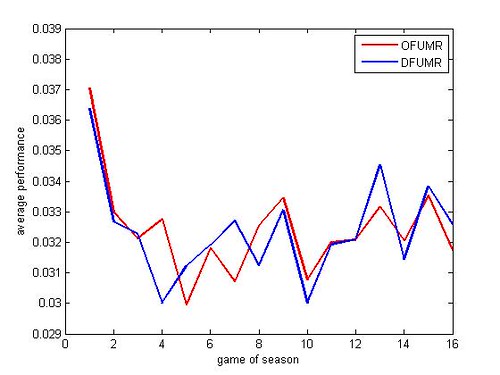
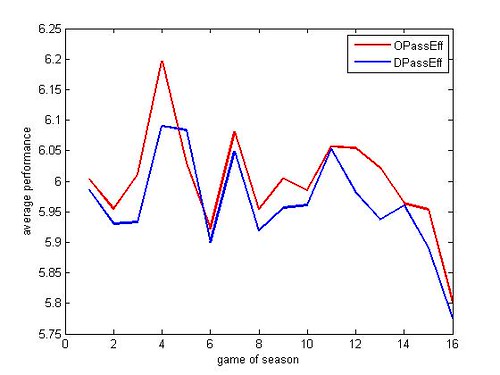
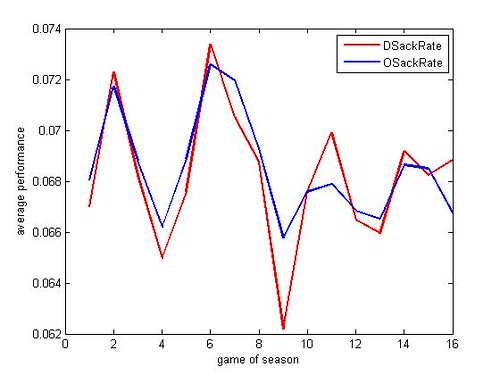
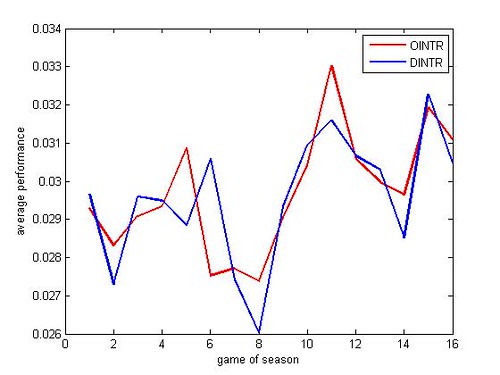
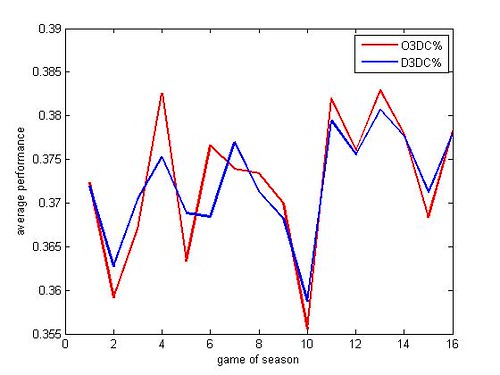
Rushing offense improves over the year by about .2 yards/attempt, but passing offense worsens over the year by about .2 yards/attempt. Sack rates don't trend either way, but interception rates increase by about .3%. So the passing game does indeed become less effective as the year progresses. The improvement in the rushing game might stem from defenses focusing more on the passing game. Also of note, kick and punt return averages decrease over the season but start to pick up again towards the end of the season. Clearly, special teams do a good job of adapating their return coverages. Do the return units start to adapt to the coverages as well?
4 comments:
Offenses are more efficient because they know what their doing whereas the Defenses have to react. You will find the defenses get progressively better as the season wears on as they get a better handle on Offensive tactics.
Great stuff.
I've never tried to do any post-season stuff. When I started, I used data from the 2005 season only. I thought, "how different could NFL football be from year to year. One year of data is enough." After all there are 256 games in a regular season. That should be plenty of data for statistical significance.
I was right and wrong. Most everything was significant, but as my predictions for 2006 went on, I realized how out of whack the coefficients were for 05 compared to 06. Note the drastically different coefficients for HFA. It was almost like they were playing different sports. I didn't feel comfortable that I had a large enough data set until I had a full 5 years of data on which to base the regressions.
For post-seasons include only a couple games for each team. You'd need many, many years of post-seasons to add up to the statistical power of one regular season. And we know we need much more than one regular season to have reliable coefficients.
My sense about the playoffs is that they are very over-analyzed. I don't believe there is a substantive difference between the regular season sport and the sport they play in January. The only thing different is the quality of opponent.
So, to get a fair data set, you might want to compare the results you have for the playoffs with results from regular season games between playoff caliber teams and other types of games (playoff vs. non-playoff, non vs. non).
Typo--delete the "For" at the start of the 3rd para.
Even though this is an old article, I just wanted to say this is excellent work. A couple of questions:
1) What's the sample size? Which seasons were included in this study?
2) Do offensive & defensive efficiency stats come from FO?
Thank you.
Post a Comment