Does Balance in Play Calling Matter?
If, on a given Sunday, your running game just can't get anything done, does it pay to continue calling running plays? Should you just abandon it for the passing game? Do you REALLY want Joey Harrington throwing the ball sixty-two times in a single game, Osaban Bin Lyin'? This really isn't about the running game setting up the passing game, per se. As it turns out, over 1994-2006, unadjusted pass and run (offensive) efficiency have a correlation coefficient of -0.0084705, essentially zero. They're "unrelated." Talent probably wins out. Adjusted efficiencies don't fare much better. Instead, I'm simply testing whether or not an imbalance in play calling negatively affects offensive efficiency. Ideally, on a graph where X is the ratio of pass plays called to run plays called and Y is the offensive efficiency, we'd expect a parabola peaking at 1-1, or at least something that looks like one.Correlation of stat with percentage of plays run that are pass plays Statistic Corr. Coef. Run Eff, Unadj -0.19428 Run Eff, Opp Adj -0.16552 Run Eff, HF Adj -0.19233 Pass Eff, Unadj -0.24897 Pass Eff, Opp Adj -0.28482 Pass Eff, HF Adj -0.24415 Off Eff, Unadj -0.12309 Sack Rate, Unadj 0.069636 Sack Rate, Opp Adj 0.052371 Sack Rate, HF Adj 0.066329 Int Rate, Unadj 0.13693 Int Rate, Opp Adj 0.11492 Int Rate, HF Adj 0.13295 Fum Rate, Unadj 0.19613 Fum Rate, Opp Adj 0.1806 Fum Rate, HF Adj 0.19536 Margin of Victory/Defeat -0.59146
If I check correlation with an imbalance stat (absolute value of .5 - proportion of plays called that are pass plays), the numbers aren't much different but here's a quick summary.
Run efficiencies: ~-0.11
Pass efficiencies: ~-0.14
Total offensive efficiencies: ~-0.08
Margin of victory/Defeat: -0.38188
So, play calling imbalance seems to have a negative effect on offensive efficiency, but it could just mean that losing teams, which are generally teams that aren't performing as well statistically, are forced to abandon the running game to try and catch up. And of course, teams that are winning will abandon the passing game to run out the clock. The margin of victory/defeat correlation coefficients seem to back up this theory. But I would hardly say that the numbers are conclusive. Take a look at the graphs. I've included only 2 of the charts for brevity's sake and just to get an idea of how much they do not look like parabolas.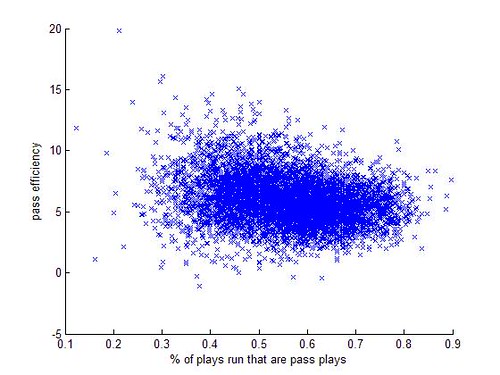
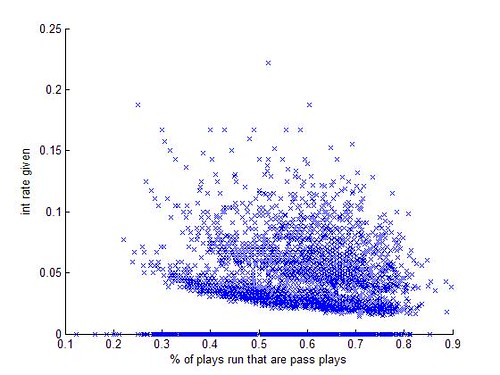
They're essentially blobs with some vague direction. This is the face of low correlation. I'd like to revisit this article later on with finer grained data. Once I collect some play-by-play data (hopefully the NFL.com gamebooks won't be too hard), I plan on breaking down this data by quarter/half or scoring margin, to see how ability and game plans affect the results rather than how results affect the game plan.
2 comments:
Derek-good post.
How do you put html tables into blogger? Manually?
I enter them manually. I manually generate the HTML for the tables and then use the HTML code from this blog to get rid of the huge honkin' white spaces put beneath and above the tables.
Post a Comment